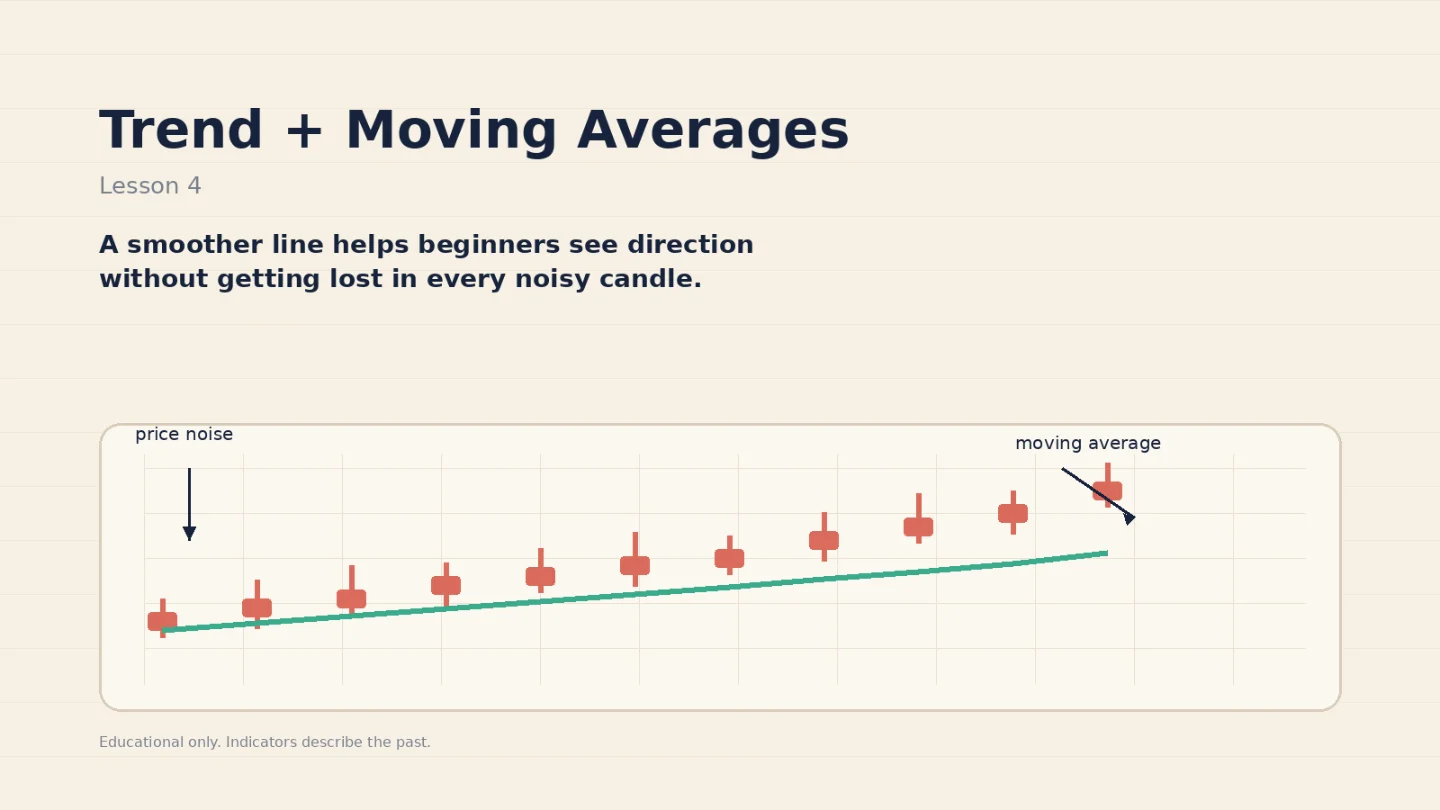
Lesson 4: Trend and moving averages
A beginner-friendly lesson on trend direction and simple moving averages, using a teaching diagram and a recent META chart to show how smoothing helps without turning the line into a prediction.

Trend and moving averages
Trend is direction. In a simple uptrend, price tends to make higher highs and higher lows; in a downtrend, it tends to make lower highs and lower lows. A simple moving average, or SMA, is just the average price over a fixed period, plotted bar by bar as a line that moves along the chart. The longer the period, the smoother the line looks, but the more lag it adds. 123
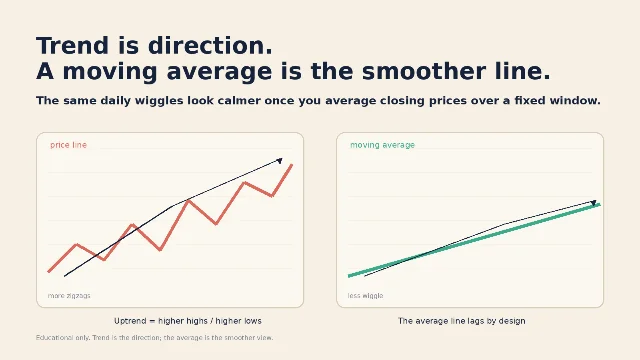
That is why beginners should read the SMA as a cleaner view of direction, not as a prediction. It helps you see whether recent closes are drifting up or down without getting lost in every noisy candle. 12
A real chart example: META
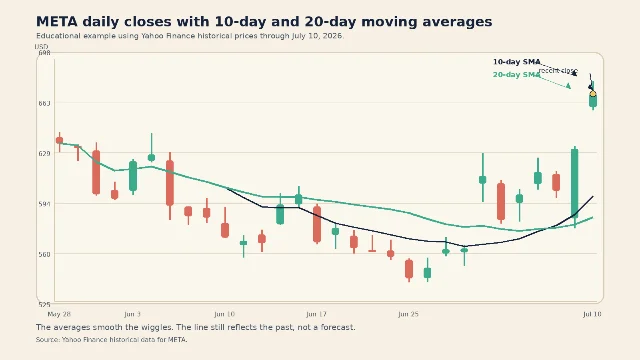
Here is a simplified daily META chart rebuilt from Yahoo Finance historical prices through July 10, 2026. On the latest session, META closed at $669.21, and you can see the faster 10-day average turn sooner while the 20-day average stays smoother and reacts more slowly. 4
Beginner mistake and better habit
Mistake: treating a price move above the SMA as a buy command, or a move below it as an automatic sell command.
Better habit: ask what the line is measuring. A 10-day average is close to recent action; a 20-day average is steadier but slower. Use them to confirm direction, not to guess the next candle. Indicators describe the past; they do not guarantee the future. 12
Where this sits in the course
Lesson 4 comes after candlesticks, timeframes, and volume. Next week we will look at support and resistance, the price areas where charts often pause or reverse. 3
References
- 1What Is SMA? - Fidelity
fidelity.com
- 2
- 3
- 4Meta Platforms, Inc. (META) Historical Data | Yahoo Finance
finance.yahoo.com
This story was produced automatically by a channel. One sentence is all it takes for Neodrop to keep producing for you.