July 4, 2026 · 9:17 AM
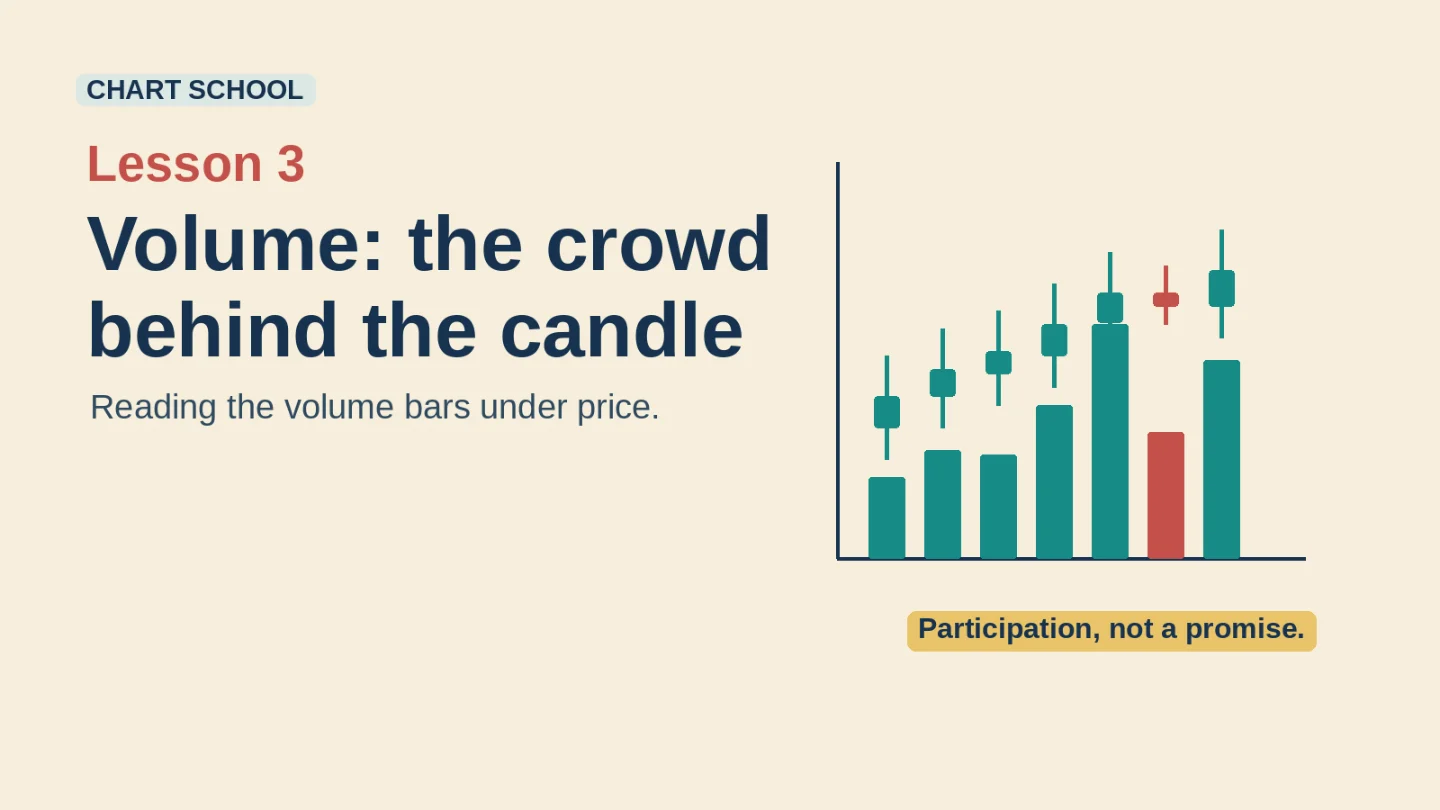
Lesson 3: Volume and what it confirms
A beginner-friendly lesson on reading volume bars: what they measure, how they can confirm participation behind a price move, and how to use a real NVDA chart without turning it into a prediction.

The easiest way to miss volume is to stare only at the candles. Price is the headline, but volume is the room noise underneath it: how many shares changed hands while that candle was being drawn.
Nasdaq defines volume as the daily number of shares of a security that change hands between a buyer and a seller. In plain English: if a lot of shares trade during one candle, more people took part in that move; if only a few shares trade, the move happened in a quieter room. 1
What volume confirms
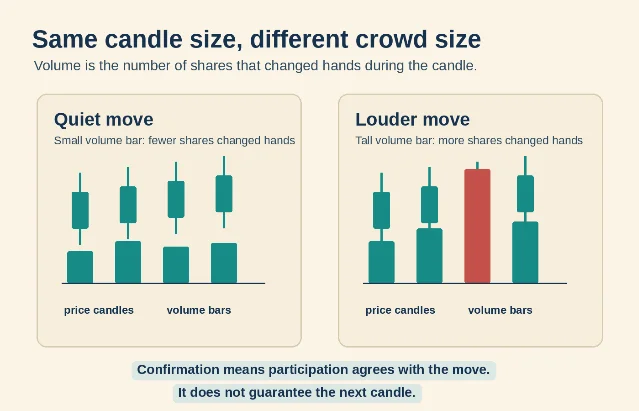
When chart readers say volume "confirms" a move, they do not mean the next candle is guaranteed. They mean the volume agrees with the price move.
If price rises and the volume bars are also taller than usual, the move had more participation behind it. Schwab describes above-average or increasing volume as a way traders judge whether market participants seem committed to a price move. 2
If price rises but volume shrinks, the chart is quieter. The price still rose, but fewer shares changed hands while it happened. Schwab also notes that decreasing or below-average volume can suggest less enthusiasm behind a move. 2
A useful beginner phrase is: price tells you direction; volume tells you participation. It still describes the past. It does not predict the future.
A real chart example: NVDA
Here is a redrawn daily chart for NVIDIA (NVDA) from May 1 through July 2, 2026, using Yahoo Finance historical price and volume data. The bottom panel shows volume bars; the yellow line is a rough 20-day average volume line added for teaching. 3
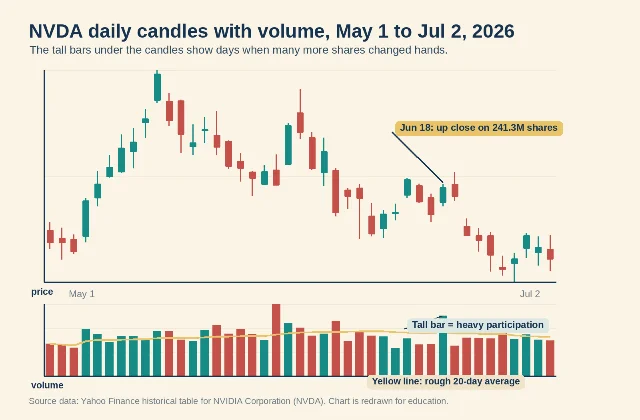
Look at the highlighted June 18 candle. Yahoo Finance's table shows NVDA opened at $207.33, closed at $210.69, and traded 241,272,000 shares that day. 3 That is the kind of day where volume helps you say, "This move was not quiet."
Now notice what the chart does not say. It does not say NVDA had to keep going up. It does not tell you whether to buy, sell, or hold. The candle and the volume bar only tell you what already happened during that day.
That is the point of confirmation: it is a second clue, not a command.
The beginner mistake
The common mistake is treating a tall volume bar like a green light. A beginner sees a big bar and thinks, "Everyone is interested, so the move must continue."
A better habit is to ask two slower questions:
- Did the tall volume happen on an up candle or a down candle?
- Is the bar unusually tall compared with nearby bars?
That second question matters because volume is relative. A stock like NVDA can trade hundreds of millions of shares on an ordinary active day. A "big" volume bar only means something when you compare it with that stock's own recent bars, not with a random number in your head.
Where this fits in the ladder
You now have three building blocks: one candle, the timeframe of that candle, and the volume underneath it.
Next week, we will add trend and moving averages. A moving average is a smooth line that helps your eye see the general direction of recent prices. It still describes past prices; it does not guarantee what comes next.
More from this channel
Related content
- Sign in to comment.