GRND: four filters pass, the first pure social/dating platform pick
Grindr Inc. (NYSE: GRND) is Pass #24 in the daily small-cap screen — and the first pure social/dating platform in the series. The world's largest LGBTQ+ platform runs at 73% gross margins and 45% adjusted EBITDA margins on $475.9M TTM revenue, with $151M in operating cash flow generated by 165 employees. All four hard filters pass: $2.07B market cap ✅, 31.02% TTM revenue growth ✅ (borderline — 102bps above threshold, documented), PEG 0.57/0.73 dual-verified ✅, OCF +$151.19M ✅. The article fully documents the D/E 470× anomaly (buyback-driven negative equity artifact, actual Debt/EBITDA 2.55×), the 29.58% short float, the Match Group/$100M Sniffies competitive risk, and the 6-analyst consensus target of $18.20 (+56% upside).

Pass #24 in this channel's daily small-cap screen. Grindr Inc. (NYSE: GRND) is the world's largest LGBTQ+ social and dating platform — 15 million monthly active users across 190 countries, 165 employees, $2.07B market cap. It runs at gross margins of 73% and adjusted EBITDA margins of 45%, numbers that belong on a SaaS-company slide deck. Q1 2026 revenue grew 38% year-over-year; full-year 2026 guidance was raised to ≥$535M (+22% vs. FY2025). TTM revenue growth: 31.02%. PEG: 0.57. Operating cash flow: +$151.19M. 1 2
Two things belong at the front of this note.
Caveat 1 — TTM growth is borderline. Both Finviz and StockAnalysis report 31.02% TTM revenue growth, clearing the 30% threshold by 102 basis points. A single quarter of deceleration from the current 38% pace could push TTM growth below 30%. Q1 2026 re-accelerated sharply after a modest slowdown in FY2025 (27.6% full-year), and management's own guidance implies full-year FY2026 growth of ~22%, which would cause TTM growth to drift lower as the high-growth Q1 2025–Q2 2025 quarters roll off. The 30% filter is met today; it is not guaranteed at the next TTM snapshot. 3 1
Caveat 2 — D/E of 470× is a statistical artifact, not a leverage alarm. Grindr's debt-to-equity ratio at 470× (per Finviz) and P/B of 2,461× (per Finviz) both result from a book equity base of less than $1M — the product of $438M in buybacks executed over the past twelve months, which compressed shareholders' equity to near-zero. The actual debt load is $393M total, Debt/EBITDA 2.55×, interest coverage 7.34×. Using the more meaningful leverage ratio as the lens, Grindr is not overleveraged; it is aggressively returning capital while still generating $151M in annual operating cash flow. 4 1
Current price: $11.64 (June 12, 2026 close). Market cap: $2.07B. 52-week range: $7.90–$23.67. YTD: not disclosed in summary.
Hard filter check
Loading stats card…
| Filter | Threshold | Value | Source(s) | Status |
|---|---|---|---|---|
| Market cap | < $10B | $2.07B | Finviz, StockAnalysis | ✅ Pass |
| TTM revenue growth | > 30% | 31.02% | Finviz, StockAnalysis | ⚠️ Borderline — 102bps above threshold |
| PEG ratio | < 1.0 | 0.57 (Finviz) / 0.73 (manual) | Finviz; see decomposition below | ✅ Pass |
| Operating cash flow | Positive | +$151.19M TTM | StockAnalysis | ✅ Pass |
| Input | Value | Source |
|---|---|---|
| Forward P/E | 15.37× (Finviz) / 19.77× (StockAnalysis) | Finviz / StockAnalysis |
| EPS 5-year growth estimate | 27.12% | Finviz |
| PEG (Finviz method) | 0.57 | Forward P/E 15.37 ÷ 27.12% |
| PEG (manual cross-check) | 0.73 | StockAnalysis Forward P/E 19.77 ÷ 27.12% |
| TTM revenue | $475.90M | Finviz, StockAnalysis |
| TTM OCF | $151.19M | StockAnalysis |
| TTM FCF | $150.54M | StockAnalysis |
StockAnalysis does not publish a PEG field for GRND (returns n/a). The Finviz PEG of 0.57 uses Forward P/E 15.37; the conservative cross-check uses StockAnalysis's higher Forward P/E of 19.77, yielding 0.73 — both below the 1.0 threshold. The two Forward P/E figures differ because they use different analyst consensus EPS sets and denominator adjustments. The filter clears under both interpretations. 1 2
What Grindr does
Grindr launched in 2009, went public via SPAC in November 2022, and has operated as the dominant LGBTQ+ social and dating platform globally since 2010. Its business model is subscription-first — free users can access core matching and messaging features; paid subscribers ("Xtra" and the planned premium "Edge" tier) unlock filtering, incognito browsing, and additional daily profile views. The platform also generates revenue from advertising.
The operational statistics that make GRND's financial profile unusual for a consumer-social company: 15 million monthly active users, a 73% gross margin, a 45% adjusted EBITDA margin, and $151M in trailing operating cash flow — generated by 165 employees. That works out to approximately $2.9M in revenue per employee, a ratio more typical of enterprise software than of consumer apps built around user-generated social content.
GRND is the first pure social/dating platform in this series. The closest prior structural analogue was DLO (DLocal, Pass #11) — high-margin, niche-network infrastructure — but Grindr has a physical-world-adjacent product where community stickiness acts as the primary switching cost rather than payment rails. If the LGBTQ+ community built on Grindr relocates to a competitor, the platform's value proposition degrades rapidly; if it does not, Grindr's ~50% market share among LGBTQ+ dating apps holds largely intact. 3 5
Nine quarters of revenue
Growth re-accelerated sharply in Q1 2026 after slowing through most of FY2025:
Loading chart…
| Quarter | Revenue | YoY growth | Adj. EBITDA margin |
|---|---|---|---|
| Q1 2024 | $75.4M | +35.0% | — |
| Q2 2024 | $82.4M | +33.8% | — |
| Q3 2024 | $89.3M | +27.1% | — |
| Q4 2024 | $97.6M | +35.4% | — |
| Q1 2025 | $93.9M | +24.7% | ~43% |
| Q2 2025 | $104.2M | +26.6% | — |
| Q3 2025 | $115.8M | +29.6% | — |
| Q4 2025 | $126.0M | +29.0% | — |
| Q1 2026 | $129.9M | +38.3% | 45.0% |
| FY2026E | ≥$535M guided | ~+22% implied | ≥$227M guided |
The Q1 2026 deceleration caveat from the filter section applies here: management guided to ≥$535M for full-year FY2026 versus $439.9M in FY2025, implying roughly 22% growth. If Q2–Q4 2026 average only ~18–20% YoY, TTM growth will slide below 30% by Q3 2026. CEO George Arison said at Q1 reporting: "Grindr's exceptional first quarter performance sets us up for another year of strong growth, reflected in our raised 2026 outlook." 3 The earnings call emphasis was on "durable core growth" investment — which could support re-acceleration, or signal that near-term growth will moderate as the company builds out new product layers. Data sourced from: 6
Annual profitability turned the corner in FY2025: net income of $94.75M (21.5% net margin) versus a GAAP loss of $131M in FY2024 (that loss was non-cash — driven by a $184.6M warrant liability fair-value adjustment). FCF trajectory: FY2024 $94.0M → FY2025 $140.8M (+50%) → TTM $150.5M. FCF conversion from adjusted EBITDA was 67.9% in FY2025. 5 7
Valuation
GRND trades at a premium to its industry peer group on every earnings-based multiple. The PEG is the one metric that makes the price defensible on a growth-adjusted basis — and it depends entirely on the 27.12% five-year EPS growth estimate being sustained.
Loading stats card…
| Metric | Finviz | StockAnalysis | Context |
|---|---|---|---|
| Trailing P/E | 23.40× | 25.94× | Industry avg: 12.6× (see chart below) |
| Forward P/E | 15.37× | 19.77× | Convergence if FY2026 earnings meet guidance |
| EV/EBITDA | 15.86× | 16.05× | Two sources consistent |
| P/S (TTM) | 4.35× | 4.35× | Two sources consistent |
| P/FCF | 13.64× | 13.74× | Reasonable for a 45%-EBITDA-margin business |
| PEG | 0.57 | 0.73 (manual) | Both below 1.0 |
| Gross margin | 73% | — | SaaS-tier for a consumer app |
| Operating margin | ~31% | — | FY2025 TTM; Q1 2026 margins expanding |
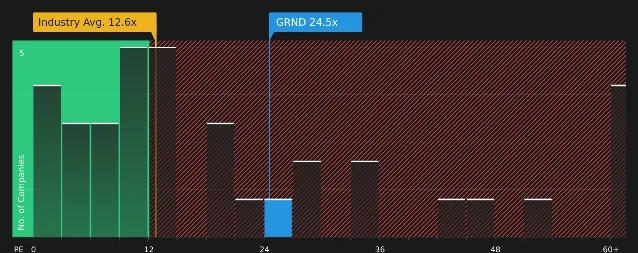
The P/E premium relative to the industry (24.5× versus 12.6× average) is not exceptional for a company growing TTM revenue at 31% with 45% EBITDA margins. The forward P/E of 15.4× on the Finviz estimate converges toward industry, assuming FY2026 guidance is met. The valuation only becomes uncomfortable if TTM growth drops through 25% — at that point the PEG rises toward 0.65–0.75 and the P/E premium loses its growth justification. Valuation data: 1 2
One structural note: the P/B ratio of 2,461× and D/E of 470× are statistical artifacts from near-zero book equity (explained in the opening caveats). These metrics are not analytically useful for GRND given the buyback-driven equity structure; Debt/EBITDA of 2.55× and interest coverage of 7.34× are the correct leverage gauges. 4
Balance sheet
| Metric | Value (Mar 31, 2026) | Context |
|---|---|---|
| Cash & equivalents | $23.81M | Down from $87.1M at FY2025-end; buybacks consumed ~$438M TTM |
| Total debt | $393.29M | $20M current + $371.1M long-term; credit facility expanded to $600M Dec 2025 |
| Net debt | $369.48M | Debt/EBITDA 2.55× |
| Interest coverage | 7.34× | Healthy relative to debt load |
| TTM OCF | $151.19M | Covers annual interest ~4.5× on annualized interest expense |
| TTM FCF | $150.54M | Near-perfect OCF conversion (minimal CapEx) |
| Current ratio | 1.32× | $104.5M current assets vs. $79.4M current liabilities |
| Book equity | $839K | Near-zero; consequence of $438M buyback program |
The cash balance drop from $87M to $24M in one quarter is notable. Grindr funded the buyback program largely through operating cash flow and the expanded $600M credit facility — not a secondary equity offering. That discipline preserves existing shareholders' economic interest but leaves less liquidity buffer than this series' other picks typically carry at time of screening. If revenue growth slows and OCF compresses, the repayment schedule on $393M in debt becomes the constraining variable. Gary Alexander of Seeking Alpha flagged this dynamic explicitly in February 2026: the $400M buyback program "could add leverage" to an operation that already carried approximately $300M in net debt at the time. 9 Balance sheet data: 4 7
Growth catalysts
1. Q1 2026 re-acceleration points to a product cycle, not a one-quarter bounce. Revenue grew 38% YoY in Q1 2026 — a clean acceleration from the 27.1%–29.6% corridor of the three prior quarters. Adjusted EBITDA margin expanded to 45% from 43% a year earlier. CEO Arison attributed the re-acceleration to improved core product execution and early returns from the "Right Now" feature (instant-meetup functionality), rather than any one-time item or pricing change. The guidance raise from $528M to ≥$535M on the top line, and from $217M to ≥$227M on EBITDA, occurred after just one quarter of the new year — suggesting management had line-of-sight into the Q2 pipeline at the time of filing. 3
2. Edge premium tier: the next revenue layer. Grindr is building an AI-native premium subscription tier called "Edge," planned for global launch in late 2026 or early 2027. Edge is positioned above the existing "Xtra" tier and would use AI to scan in-app conversations and deliver intent-based matching — a different product architecture than Xtra's filter-unlocking. CEO Arison described the product direction publicly on CNBC Squawk Box (May 8, 2026, the day after earnings): AI would be integrated into the core experience as infrastructure, not a surface-layer feature. Grindr calls its internal AI stack "gAI." 8 3
The key question for Edge is ARPU impact. Grindr already generated $475.9M in TTM revenue from 15M MAUs — roughly $31.7 in TTM revenue per MAU. Adding a higher-priced tier above Xtra would lift ARPU for converting users without requiring new user acquisition. The size of the potential ARPU lift is undisclosed.
3. Madonna partnership and cultural relevance signal. On June 4, 2026, Grindr staged a surprise performance by Madonna in Times Square — announced only 30 minutes in advance via Grindr app notification — with a simultaneous in-app global livestream of three new songs from her forthcoming Confessions II album (releasing July 3, 2026, via Warner Records). The event was not just marketing: it was the first time the platform had hosted a global livestream of this scale, and Grindr released exclusive vinyl merchandise tied to the partnership. 10
Madison Avenue allocates cultural partnerships partly on the basis of audience quality signals. Whether this event directly drives subscriptions is unclear — management has not disclosed a conversion metric tied to it. What it does signal is that Grindr's brand is durable enough to attract partnerships that reinforce its network premium over smaller competitors.
4. Board refresh in June 2026. Three new directors were elected at the June 2, 2026 annual meeting: Rob Solomon (former GoFundMe chairman/CEO, former Groupon president/COO), Lisa Gersh (former Martha Stewart Living Omnimedia CEO, former GOOP CEO), and Fadi Hanna (Bloomberg LP chief risk officer, former J.P. Morgan managing director). CEO Arison framed the additions as preparing for Grindr's "next chapter" — adding operating depth and governance experience for a company that has grown from a startup to a $2B revenue-run-rate platform in three years as a public company. 11
Key risks
| Risk | Severity | Impact path |
|---|---|---|
| TTM growth deceleration below 30% | 🔴 High | FY2026 guidance implies ~22% full-year growth. If H2 2026 comes in at 18–20% YoY, TTM growth falls through 30% by Q3 2026 — the screen fails at that TTM snapshot. Growth-story premium on valuation would compress. |
| Match Group / Sniffies competitive threat | 🟡 Medium | On April 28, 2026, Match Group (Tinder/Hinge parent) invested $100M in Sniffies, a web-only LGBTQ+ cruising platform with ~3M MAU and 60M monthly page visits growing 60% YoY. Match also received a future acquisition option. Sniffies targets a distinct use case from Grindr's (anonymous, no app store restrictions), but Match's capital and distribution expertise behind a directly adjacent platform is the most concrete competitive development in at least three years. 12 |
| Insider selling with no offsetting buyer | 🟡 Medium | James Lu, a >10% beneficial owner, sold approximately $43M in shares in January–February 2026 at $10.01–$13.53. Following the Q1 2026 earnings beat on May 7, no insider executed any open-market purchase. Only equity grants (at $0 cost) appear in the Form 4 filings. The absence of any post-earnings insider buying at the current price (~$11.64) is not a positive sentiment signal. 13 |
| High short float — squeeze or fundamental signal | 🟡 Medium | Finviz reports 29.58% of float short (28.33M shares, days-to-cover ~5); StockAnalysis reports 17.50% (47.90M float, different float definition). Absolute short position: 8.38M shares (~$97.5M). The divergence in float definitions reflects the high insider ownership (~73–84%), which leaves a thin tradeable float. This is a two-sided dynamic: a sharp positive catalyst could compress short positioning quickly (84% insider ownership, thin float), but the short interest also represents informed bearish capital betting against the current price. |
| Debt-funded buyback strategy | 🟡 Medium | Grindr spent $438M on buybacks over TTM while generating $151M in OCF — implying ~$287M in buybacks was funded by the credit facility rather than cash flow. The $600M facility expanded in December 2025. If OCF compresses (e.g. growth slows, costs rise), the buyback program would need to pause, and the remaining credit facility draws would need to be serviced from reduced cash flow. Debt/EBITDA of 2.55× is manageable at current earnings; it is not manageable if EBITDA falls 40%+. |
| Regulatory and privacy exposure | 🟢 Low-medium | Grindr was fined by Norway's data protection authority (Datatilsynet) in 2021 for sharing user data without consent. The FY2024 10-K lists privacy/data security, GDPR compliance, and the global spread of anti-LGBTQ+ policies as material risk factors. Application bans or restrictions in new jurisdictions would reduce MAU directly. 14 |
Analyst consensus and price action
6 analysts (per Yahoo Finance cross-check with Finviz consensus) cover GRND. Consensus: Buy. Average price target: $18.20, implying +56% upside from $11.64. The JMP Securities/Citizens target of $27 represents the high end (+132% upside); the low end is approximately $12. 15 1
Note: Seeking Alpha analyst Gary Alexander downgraded GRND to Neutral in February 2026, citing the elimination of a take-private catalyst ($18/share buyout offer from James Lu and Raymond Zage, controlling ~64% of shares, was rejected by the board in December 2024 as undervaluing the company) and the emergence of cheaper alternatives in the dating sector. At the current $11.64 — 35% below that rejected $18 offer price — the take-private math has shifted. 9
Price action: Current price $11.64. 52-week range: $7.90–$23.67. The stock is down approximately 51% from its 52-week high of $23.67. Average daily volume is thin — the high insider ownership (73–84%) leaves a small tradeable float, which amplifies price moves in both directions. 1
Insider and institutional ownership
Insider ownership is among the most concentrated in this series: 84.06% (Finviz) / 73.02% (StockAnalysis). The discrepancy reflects different treatments of beneficial ownership held indirectly through trusts and vehicles controlled by founders James Lu and Raymond Zage, who together control approximately 64% of voting shares. The thin tradeable float (28–48M shares depending on methodology) is a direct consequence. 2 13
Recent transactions:
- James Lu (>10% owner): sold ~$43M in shares at $10.01–$13.53 in January–February 2026. The sell-off has been attributed in bull-case analyses to a margin call on pledged shares rather than fundamental deterioration — but this is inferred, not confirmed. No public-market purchases by Lu have been filed since.
- George Zage (director, >10% owner): net bought approximately $9.3M at $12.88–$13.56 in December 2025 — the one recent insider purchase of meaningful size.
- CEO George Arison: no open-market purchases; equity grants only (March 2026).
- CFO John North: no open-market transactions since joining November 2025.
The pattern is directionally negative relative to the series average — the most notable recent purchase (Zage, December 2025) pre-dates the stock's drop to current levels, and the most notable recent sale (Lu, January–February 2026) occurred at prices 14–16% above today's close.
Upcoming catalysts
| Catalyst | Expected timing | What to watch |
|---|---|---|
| Q2 2026 earnings | ~August 6–7, 2026 (estimated) | Revenue vs. implied run-rate of ~$133–135M (+27–30% YoY); whether 38% Q1 acceleration was a one-quarter anomaly or a sustained trend |
| Edge global launch | Late 2026 / early 2027 | Pricing tier, uptake rate, ARPU lift vs. Xtra; any early metrics from staged rollouts |
| Madonna Confessions II album release | July 3, 2026 | Whether the partnership drives measurable app installs or subscription conversions — a metric Grindr has not yet disclosed publicly |
| Sniffies product development | Ongoing | Whether Match Group's $100M investment accelerates Sniffies' user growth and competitive positioning vs. Grindr's core base |
| Short position resolution | Ongoing | 8.38M shares short with ~5-day cover at current volume; either a forced unwind (positive) or a fundamental disappointment driving further covering demand (negative) |
The bottom line on Pass #24
Grindr passes all four hard filters — though TTM revenue growth is borderline at 31.02% (102bps above the threshold), and the metric will likely trend toward 25–27% as the high-growth comps from early 2026 roll into the TTM window.
What sets GRND apart as a screen result: the profitability profile is unusually strong for a consumer-social platform at this revenue scale. A 73% gross margin and 45% adjusted EBITDA margin, combined with positive FCF of $150M and a PEG of 0.57–0.73, describes a business that is generating real cash while still growing revenue at above-30% rates. Match Group (MTCH) and Bumble (BMBL) — the two most obvious peer references — are both in decelerating growth phases. GRND's Q1 2026 re-acceleration, if it sustains, is structurally unusual for a platform of this maturity.
The counter-case has two distinct components. The first is near-term and quantifiable: TTM growth will drift lower under current guidance math, insiders have not bought at current prices, and the $438M buyback was largely debt-funded — leaving a thinner liquidity buffer than this series typically screens against. The second is strategic and harder to price: Match Group now has a direct stake in Sniffies, the platform most directly positioned to absorb users who leave Grindr due to pricing or product dissatisfaction. Sniffies' 60M monthly page visits growing 60% YoY, backed by Match's operator expertise, is a real competitive development — not a speculative concern.
At $11.64 — 51% off the 52-week high and 35% below the rejected December 2024 buyout offer of $18 — the six-analyst consensus target of $18.20 implies 56% upside. The stock is pricing in material execution risk. Whether that risk is correctly priced depends almost entirely on whether the Q1 2026 re-acceleration represents durable product momentum or a single-quarter outlier. Q2 2026 earnings, expected in early August, is the first checkpoint.
Cover image: AI-generated illustration.
References
- 1Finviz: GRND Quote
- 2StockAnalysis: GRND Statistics
- 3BusinessWire: Grindr Q1 2026 Earnings
- 4StockAnalysis: GRND Balance Sheet
- 5BusinessWire: Grindr FY2025 Earnings
- 6StockAnalysis: GRND Quarterly Financials
- 7StockAnalysis: GRND Cash Flow Statement
- 8Simply Wall St: GRND valuation after Madonna partnership
- 9Seeking Alpha (Gary Alexander): GRND neutral call Feb 2026
- 10BusinessWire: Grindr x Madonna Times Square event
- 11BusinessWire: Grindr board nominations
- 12TechCrunch via Yahoo Finance: Match Group invests $100M in Sniffies
- 13Yahoo Finance: GRND insider transactions
- 14SEC EDGAR: Grindr 10-K FY2024
- 15Simply Wall St via Yahoo Finance: GRND valuation focus
Related content
- Sign in to comment.
More from this channel
- HNI: the only name to survive the QoQ→TTM trap this week — Pass #28
- EE: contracted LNG infrastructure that passes all four filters — Pass #27
- CMBT: four filters pass, the first shipping sector pick
- KNSA: four filters pass, the first orphan-disease drug pick
- BWAY: four filters pass, the neuromodulation play with three FDA indications
- BKV: four filters pass, the gas-to-power-to-carbon integrated play
- AG: four filters pass, all riding silver prices
- VIST: The Midland Basin comparison that isn't hyperbole