BKV: four filters pass, the gas-to-power-to-carbon integrated play
BKV Corporation (NYSE: BKV) is Pass #22 — all four hard filters cleared. Market cap $2.74B, TTM revenue growth +52–125% (two TTM windows, methodology explained), PEG 0.55, OCF +$298M positive. BKV is the series' first pure-play natural gas company, operating a vertically integrated platform from Barnett Shale E&P through 75%-owned Texas gas-fired power plants (Temple I & II, 1,499 MW combined) to a four-project CCUS pipeline targeting 1.5M metric tons/year by 2028. The core analytical tension: 11 analysts unanimously rate Strong Buy with 38–40% upside to a $34.67–$35.18 average target, while every senior officer has been a systematic seller (~$12M+ in combined sales with zero purchases) and TTM FCF is –$449M as CapEx ramps to $570M–$740M in FY2026. The single cleanest binary catalyst is an unannounced Power Purchase Agreement with a data center or hyperscaler counterparty.

Pass #22 in this channel's daily small-cap screen. BKV Corporation (NYSE: BKV) is a Denver-based integrated natural gas company: upstream E&P in the Barnett Shale, midstream gathering, two combined-cycle gas power plants in Texas, and a carbon capture and storage (CCUS) platform targeting 1.5 million metric tons per year by 2028. Market cap $2.74B, TTM revenue growth 52–125% (two different TTM windows — both well above 30%), PEG 0.55, operating cash flow +$298.24M TTM. All four hard filters pass. 12
Three things belong at the top of this note.
Caveat 1 — revenue figure has a seam. The TTM growth discrepancy between Finviz (+52.41%, $1.05B) and StockAnalysis (+125.21%, $1.36B) is not a data error. Finviz uses a trailing window that skews toward the FY2025 annual figure ($1.01B vs $580.98M in 2024). StockAnalysis uses a window through Q1 2026, which adds the first full quarter of Power JV consolidation — BKV closed the acquisition of a 25% stake in the BKV-BPP Power Joint Venture in January 2026, bringing its ownership from 50% to 75% and triggering full consolidation of the two Temple, Texas power plants. Both growth rates clear the 30% threshold. The gap is methodology, not manipulation.
Caveat 2 — free cash flow is deeply negative. TTM operating cash flow is $298.24M; TTM capital expenditures are $747.64M. That produces TTM FCF of –$449.40M. This is a company in heavy construction mode: FY2026 CapEx guidance of $570M–$740M covers $200M–$280M in upstream development, $280M–$340M in power generation expansion (1.2 GW of gas turbine reservations, 6,200 acres under site control), and $90M–$120M for CCUS. Investors are effectively pre-funding a platform that does not yet exist at scale. The 11-analyst consensus (Strong Buy, average target $34.67–$35.18 vs $25.06 current price) is betting the platform will be worth the build cost.
Caveat 3 — the Altman Z-Score is 1.44. Below 1.81 puts BKV in the technical "distress" zone. The interest coverage ratio of 12.55× and $973.5M in total liquidity suggest the Z-Score is primarily a function of the company's capital structure and asset-heavy business model rather than an imminent solvency concern — but it is a number every reader should register before sizing a position.
Current price: $25.06 (June 12, 2026 close). Market cap: $2.74B.
Hard filter check
Loading stats card…
| Filter | Threshold | Reported value | Source(s) | Status |
|---|---|---|---|---|
| Market cap | < $10B | $2.74B | iTick, Finviz, StockAnalysis | ✅ Pass |
| TTM revenue growth | > 30% | +52.41% (Finviz) / +125.21% (StockAnalysis) | Finviz, StockAnalysis | ✅ Pass |
| PEG ratio | < 1.0 | 0.55 (Forward P/E 12.12 ÷ 5Y EPS growth 22.05%) | Finviz | ✅ Pass |
| Operating cash flow | Positive | +$298.24M TTM | StockAnalysis | ✅ Pass |
PEG decomposed:
| Input | Value | Source |
|---|---|---|
| Forward P/E | 12.12× | Finviz (StockAnalysis: 13.26×) |
| EPS 5-year growth estimate | 22.05% | Finviz |
| PEG (Finviz method) | 0.55 | Fwd P/E 12.12 ÷ 22.05% |
| TTM revenue (Finviz basis) | $1.05B | Finviz |
| TTM revenue (StockAnalysis, through Q1 2026) | $1.36B | StockAnalysis |
| TTM OCF | $298.24M | StockAnalysis |
| TTM CapEx | $747.64M | StockAnalysis |
| TTM FCF | –$449.40M | Derived |
What BKV does
BKV Corporation was founded in 2015 by CEO Chris Kalnin and went public on the NYSE on September 26, 2024. Headquartered in Denver, Colorado, the company operates four integrated business lines:
- Upstream (E&P): The largest natural gas producer by gross operated volume in the Barnett Shale (north Texas), producing 925.0 MMcfe/d in Q1 2026. Production is 81% natural gas, 19% natural gas liquids. The Barnett Shale position was significantly expanded through the September 2025 acquisition of Bedrock Energy Partners' assets for ~$370M, adding 97,000 net acres, 108 MMcfe/d of production, ~800 Bcfe of proved reserves, and 50 new drill locations. 3
- Midstream: Gathering, processing, and transportation infrastructure supporting the Barnett Shale position.
- Power generation: A 75% ownership stake in the BKV-BPP Power Joint Venture, which owns Temple I (752 MW) and Temple II (747 MW) combined-cycle gas and steam turbine plants in ERCOT's North Zone in Temple, Texas. BKV increased its stake from 50% to 75% by acquiring the additional 25% from Banpu Power US Corporation on January 30, 2026, for ~$115.1M cash plus 5,315,390 shares of BKV common stock. Q1 2026 generation: 1,981 GWh (+24.7% YoY), with capacity factors of 64.5% (Temple I) and 60.3% (Temple II). 4
- CCUS (Carbon Capture, Utilization and Storage): The "closed loop" strategy — capturing CO₂ emitted from the Barnett Shale production process and sequestering it underground via Class VI injection wells. Barnett Zero (operational since November 2023) has sequestered 347,400 metric tons of CO₂ life-to-date through Q1 2026. Cotton Cove achieved first injection in April 2026 (~32,000 MT/yr capacity). Eagle Ford is on track for first injection before June 30, 2026 (~90,000 MT/yr). The company targets a 1.5 million MT/year injection run-rate by 2028. 5
BKV also began taking natural gas marketing in-house during 2026, a move management expects to improve margins and commercial flexibility. The company employs 452 people and generates $2.21M revenue per employee. 5
Eight quarters of revenue
BKV's quarterly revenue history has a structural break in Q1 2026 when the Power JV consolidation shifted from 50% proportional to 75% full consolidation. Comparing restated figures is the only apples-to-apples read.
Loading chart…
| Quarter | Revenue | YoY growth | Net income to BKV | Diluted EPS | Adj. EBITDAX |
|---|---|---|---|---|---|
| Q1 2025 (original) | $78.8M | — | –$78.7M | –$0.93 | n/a (pre-JV consolidation) |
| Q1 2025 (restated) | $176.1M | — | — | — | — |
| Q3 2025 | $277.9M | n/a | $76.9M | $0.90 | $72.4M |
| Q4 2025 | $330.1M | n/a | $70.4M | $0.75 | n/a |
| FY2025 | $1.01B | +73.64% YoY | $173.1M | $1.98 | $390.0M (combined) |
| Q1 2026 | $432.8M | +145.84% YoY (vs restated) | $44.1M | $0.42 | $112.0M |
The Q1 2026 revenue of $432.8M broke down as: natural gas/NGL/oil $287.7M, power $69.0M, marketing $17.6M, midstream $2.3M, and derivatives gains $53.1M plus 45Q CCUS credits $3.1M. The Q1 2025 original revenue of $78.8M reflected weak natural gas prices and pre-Bedrock, pre-JV consolidation scale; the restated $176.1M includes the Power JV on a consolidated basis and provides a more meaningful YoY comparison. 5
BKV's Q1 2026 adjusted EPS came in at $0.22 — below analyst consensus — even as revenue beat expectations of $337.6M by 28%. The EPS miss was primarily due to the capital cost of integrating the Power JV and the elevated interest burden on $1.3B in total debt. CEO Chris Kalnin described Q1 2026 as delivering "strong execution across the business and the achievement of several important milestones." CFO David Tameron characterized results as reflecting "a continued focus on disciplined capital allocation as we invest in growth across our platform." 5
FY2026 guidance: CapEx $570M–$740M; net production 915–955 MMcfe/d; Power Adjusted EBITDAX $135M–$175M. Q2 2026 guidance: CapEx $155M–$215M; production 925–975 MMcfe/d. 5
Valuation
BKV-BPP Power Joint Venture: Temple I and Temple II plants in Temple, Texas. 4
Loading stats card…
Full valuation table across sources:
| Metric | Finviz | StockAnalysis | Context |
|---|---|---|---|
| Trailing P/E | 7.59× | 7.70× | Well below S&P 500 ~26×; reflects high trailing earnings relative to $25.06 price |
| Forward P/E | 12.12× | 13.26× | Below S&P 500 ~22× forward; market pricing in earnings decline |
| P/S (TTM) | 2.60× | 2.74× | — |
| P/B | 1.24× | 1.24× | — |
| P/OCF | 9.00× | 9.17× | — |
| EV/EBITDA | 13.92× | 6.24× | Discrepancy from different EBITDA definitions; SA uses $597.9M EBITDA (EV $3.73B ÷ 6.24); Finviz uses ~$273M narrower definition |
| EV/Sales | 3.61× | 3.73× | — |
| FCF yield | –16.43% | — | Negative due to $747.64M CapEx |
| Earnings yield | — | 10.88% | Trailing |
The EV/EBITDA discrepancy between Finviz (13.92×) and StockAnalysis (6.24×) reflects different EBITDA calculation methods — a key difference given BKV's complex P&L now includes derivatives gains, 45Q tax credits, and consolidated power operations. StockAnalysis uses $597.9M TTM EBITDA, placing BKV at 6.24× — modestly above Damodaran's Oil & Gas (Production & Exploration) sector median of 5.15× (142 firms with positive EBITDA, January 2026). 9
The trailing P/E of 7.59× looks optically cheap. The forward P/E of 12.12× is higher — the market is embedding a forecast that EPS will decline from the trailing level. The Simply Wall St consensus projects EPS declining approximately 21.5% per year over the next three years, as FY2025's $1.98 diluted EPS benefited from favorable natural gas prices and will not simply repeat. Revenue growth forecasts are more constructive at ~10% annually (3-year), reflecting the Power JV consolidation and CCUS platform build-out contributing incrementally but EPS being weighed down by CapEx and interest expense. 10
Balance sheet
| Metric | Value (Mar 31, 2026) | Context |
|---|---|---|
| Total debt | $1.266B | $500M 2030 Senior Notes (7.5%) + $100M RBL draw + $635.4M Power segment facilities (Temple I & II loans) |
| Cash & equivalents | $288.54M | — |
| Net debt | ~$978M | — |
| Total liquidity | $973.5M | $288.5M cash + $685.0M undrawn RBL availability |
| Debt/Equity | 0.57× (Finviz) / 0.56× (SA) | — |
| Debt/EBITDA | 2.14× | Within typical E&P range |
| Interest coverage | 12.55× | Strong debt-service capacity |
| Net leverage ratio | 2.02× | Up from 0.92× at Dec 31, 2025 (pre-JV consolidation) |
| Current ratio | 1.31× | — |
| Working capital | $135.41M | — |
| Altman Z-Score | 1.44 | Below 1.81 distress zone; common for capital-intensive E&P companies |
| Piotroski F-Score | 7 | Above median; positive quality signal |
| Book value/share | $20.27 | — |
The debt structure deserves unpacking. The pre-JV consolidation debt load as of December 31, 2025 was $500M in Senior Notes — a net leverage ratio of just 0.92×. After consolidating the Power JV in January 2026, BKV absorbed an additional ~$635.4M in Power segment debt (Temple Term Loan $399.4M, Temple I Loans $176M, Temple Revolving $60M). That pushed total debt to $1.266B and net leverage to 2.02× as of Q1 2026 end. At 12.55× interest coverage, servicing the debt is not the near-term issue — but the balance sheet is now structurally heavier than it was six months ago.
CFO David Tameron said the company "generated strong free cash flow from our base business and deployed capital strategically, while maintaining a solid balance sheet and substantial liquidity." 5 The $973.5M total liquidity figure provides meaningful runway relative to the $570M–$740M FY2026 CapEx guidance — but only because the company has continued tapping equity markets (two follow-on offerings totaling ~$356M net in the 7 months since IPO).
The Piotroski F-Score of 7 (scale of 0–9) is a counterweight to the Altman Z-Score concern: it measures current-period improvements in profitability, leverage, liquidity, and operating efficiency — and BKV scores well on all three dimensions by that metric.
Growth catalysts
1. Power Purchase Agreement (PPA): the single largest near-term catalyst. BKV has 1.2 GW of gas turbine reservations and site control over 6,200 acres in North Central Texas plus ~800 acres around the existing Temple complex — but no signed PPA yet. The company is running an advisor-led process with multiple prospective counterparties. A data center or hyperscaler PPA would validate the power buildout economics and could meaningfully re-rate the stock. Until a PPA closes, the power expansion plan carries execution risk without a contractually committed revenue offtake. Kalnin described the context: "With power demand in the U.S. and ERCOT markets continuing to accelerate — driven by AI-enabled data center growth and increasing electrification — BKV is well positioned to capitalize on these structural trends." 5
2. CCUS from 138K to 1.5M MT/year by 2028. Four projects are in various stages of commissioning:
| Project | Status | Expected capacity | 45Q credit basis |
|---|---|---|---|
| Barnett Zero | Operational (Nov 2023) | ~35,800 MT/yr current pace | $85/ton (geological storage) |
| Cotton Cove | First injection April 2026 | ~32,000 MT/yr | $85/ton |
| Eagle Ford | On track for injection before Jun 30, 2026 | ~90,000 MT/yr | $85/ton |
| East Texas | FID December 2025 | ~70,000 MT/yr | $85/ton |
At the 1.5M MT/year target in 2028, the 45Q credit stream at $85/MT would generate approximately $127.5M in annual revenue — effectively a new business line funded by the upstream production infrastructure already in place. BKV also signed agreements with Comstock Resources (NYSE: CRK) in February 2026 for the Bethel and Marquez facilities in Western Haynesville, extending the CCUS customer base beyond its own production. Q1 2026 CCUS CapEx was $20.0M; FY2026 guidance is $90M–$120M. 5
3. ERCOT power market tightness. The two Temple plants benefit structurally from Texas grid constraints. In Q1 2026, Winter Storm Fern drove a 24.7% increase in power generation with no forced outages — the average spark spread across BKV's fleet was $22.21/MWh, and FY2026 Power Adjusted EBITDAX guidance is $135M–$175M. BKV is also studying FEED (Front-End Engineering and Design) for CO₂ capture directly from the Temple gas turbines — a project that would close the loop between the power generation and CCUS segments. 5
4. Bedrock acquisition integration and Barnett production ramp. The Bedrock assets added a 7% annual base decline rate (unusually low) across 97,000 net acres and 80 low-cost refrac locations alongside the 50 new drill locations. Q1 2026 upstream production of 925.0 MMcfe/d was 21.5% above Q1 2025's 761.1 MMcfe/d. Advanced well completions exceeded type curves in Q1 2026 — the one operational bright spot against an otherwise capital-heavy quarter. 3
5. Natural gas hedges provide revenue floor. BKV has hedged ~121.5 billion MMBtu of 2026 natural gas production at a weighted-average swap price of $3.86/MMBtu, plus forward hedges running into 2027–2029. Gas basis, NGL, and power derivatives are also in place. The hedge book reduces downside from price swings while still leaving upside participation. 5
Key risks
| Risk | Severity | Impact path |
|---|---|---|
| Negative free cash flow | 🔴 High | TTM FCF –$449.40M. CapEx guidance of $570M–$740M in FY2026 exceeds $298.24M TTM OCF by $272M–$442M. Sustained negative FCF requires continued equity issuance or debt draws, compounding dilution and leverage. Q1 2026 alone: OCF $72.0M vs accrued CapEx $118.6M. |
| Systematic insider selling | 🔴 High | CEO Kalnin sold ~$11.1M in shares from Nov 2025 to Mar 2026 (100K shares at $30.06 on Mar 25, 100K at $27.13 on Nov 11, 100K at $26.16 on Nov 10, and others). President Jacobsen sold 25K shares at $26.89 on Jun 1, 2026 ($672K). CFO Tameron sold 7,300 shares at $29.71 on Mar 27, 2026. CLO Larrick has sold systematically every 1–2 months since July 2025. No insider purchases detected. 1 |
| High short interest | 🟡 Medium | 14.97% of float short (4.75M shares), 5.1 days to cover. Short thesis centers on negative FCF, EPS decline outlook, and heavy dilution. A PPA announcement or CCUS milestone could trigger a short squeeze; a guidance cut could validate the bears. |
| Share dilution track record | 🟡 Medium | Shares outstanding increased 20.20% YoY to 109.17M, through two follow-on offerings (Dec 2025: 6.9M shares / $170.1M net; Mar 2026: 5.55M company shares / $186.2M net) plus 5.32M shares issued for the Power JV acquisition. The $100M share buyback announced December 2025 offsets some dilution but represents less than 4% of market cap at current prices. |
| PPA execution timeline | 🟡 Medium | The power expansion investment thesis depends on securing Power Purchase Agreements at economics that justify $280M–$340M in FY2026 power CapEx. No PPA has been signed as of Q1 2026. If hyperscaler demand proves slower to materialize or competitors sign agreements first, BKV may be holding built capacity at spot ERCOT prices for longer than planned. |
| Altman Z-Score and EPS outlook | 🟡 Medium | Z-Score 1.44 (distress zone). Consensus projects EPS declining 21.5% annually over 3 years — meaning the trailing P/E of 7.59× will drift higher as earnings normalize from elevated FY2025 levels. At declining EPS and a forward P/E of 12.12×, the stock is not as cheap as the trailing multiple implies. |
| Natural gas price sensitivity | 🟢 Low-medium | BKV's upstream segment is a natural gas E&P play. Gas price weakness would compress upstream margins and OCF, increasing the gap between operating cash flow and CapEx. The hedge book partially mitigates 2026 exposure (~121.5B MMBtu hedged at $3.86/MMBtu), but the 2027–2029 book has lower coverage. |
| Controlling shareholder overhang | 🟢 Low-medium | Banpu North America Corporation (Thai parent Banpu Public Company) controls ~63.4% of BKV shares (69.19M out of 109.17M outstanding). Banpu's interests as a major shareholder may not fully align with public minority shareholders, particularly on capital allocation decisions regarding the Power JV and equity offerings. A Schedule 13D was filed February 6, 2026. |
Price action and technicals
Current price: $25.06 (June 12, 2026 close). YTD: –7.70%. 52-week range: $19.56–$32.81.
BKV reached its 52-week high of $32.81 in late April 2026, then fell approximately 22% in about six weeks to $25.06. The decline coincided with Q1 2026 earnings on May 7 — which beat revenue consensus by 28% ($432.8M vs $337.6M expected) but missed adjusted EPS consensus ($0.22 reported vs implied consensus). Prior to the Q1 report, a March 2026 secondary offering of ~9.7M shares (including 4.14M shares from selling stockholder Bedrock Energy Partners) added near-term supply pressure.
The RSI(14) stood at 34.30 as of June 12 — approaching the conventional 30 oversold threshold, though not yet crossing it. The stock sits below all three major moving averages: SMA20 by –7.09%, SMA50 by –10.49%, and SMA200 by –6.15%. Beta is 1.12, slightly above market. Average 20-day volume runs 686K–932K shares; June 12 volume of 651K was 0.70× the 20-day average. 12
Short interest of 14.97% of float (5.1 days to cover) is elevated but not extreme for a recently IPO'd name with a complex thesis. The YTD price decline of –7.70% compares poorly against the S&P 500 and the energy sector year-to-date, though BKV's September 2024 IPO means the trading history is less than 10 months old.
Analyst consensus: Strong Buy, $34–$37 average target
| Firm | Analyst | Rating | Price target | Date |
|---|---|---|---|---|
| Truist Securities | Gabe Daoud | Buy | $37.00 | Mar 24, 2026 |
| Jefferies | Lloyd Byrne | Buy | $35.00 | Apr 15, 2026 |
| KeyBanc | Tim Rezvan | Overweight | $35.00 | Apr 2, 2026 |
| Evercore ISI | Stephen Richardson | Outperform | $33.00 | Apr 6, 2026 |
| Citi | Scott Gruber | Buy | $33.00 | Jun 11, 2026 (cut from $36) |
| Roth | Leo Mariani | Buy | $31.00 | — |
11 analysts cover BKV (StockAnalysis), all with Buy/Overweight/Strong Buy ratings. Consensus: Strong Buy. Average price target: $34.67 (Finviz) / $35.18 (StockAnalysis), implying 38–40% upside from $25.06.
No downgrades have been issued in the coverage history — only initiations and price-target adjustments. The most recent movement was Citi cutting its target from $36 to $33 on June 11, 2026, while maintaining its Buy rating. The 11-analyst unanimous Buy consensus, combined with a 38–40% implied upside gap, is unusual for a stock at 52-week mid-range. It either means the analysts are right and the stock is genuinely undervalued, or the consensus has not yet caught up with structural concerns around EPS trajectory and FCF burn.
Insider and institutional ownership
Institutional ownership: 36.64% (Finviz) / 36.66% (StockAnalysis), across the public float of ~31.7M shares.
Insider / affiliated ownership: 70.98% (Finviz) / 3.24% (StockAnalysis). The discrepancy resolves as follows: Finviz counts all affiliated entities — Banpu North America Corporation (~63.4%, 69.19M shares), Bedrock Energy Partners (~4.8%, 5.23M shares), and CEO Kalnin (~2% including spouse) — as insiders. StockAnalysis counts only direct officer/director holdings from SEC Form 3/4 filings. The Finviz figure is the economically relevant one. Banpu is a Thai publicly listed energy company (SET: BANPU) and is BKV's founding and controlling shareholder. 114
Insider selling pattern: CEO Kalnin, President Jacobsen, CFO Tameron, and CLO Larrick have all been net sellers over the past 8 months, with no insider purchases detected. The systematic nature — CLO Larrick selling on or near the first of each month since July 2025 — suggests pre-planned 10b5-1 plan disposals rather than discretionary conviction-based selling. However, the combined dollar value of CEO sales (~$11.1M) and the absence of any corresponding purchases from any officer or director represent a signal that is inconsistent with the Strong Buy analyst consensus. 114
Upcoming catalysts
| Catalyst | Expected timing | What to watch |
|---|---|---|
| Eagle Ford CCUS first injection | Before June 30, 2026 | Confirmation that the third CCUS project has commenced; ~90,000 MT/yr capacity adds to the 45Q credit revenue stream |
| Power Purchase Agreement signing | Unknown; process ongoing | Single largest re-rating event; data center / hyperscaler deal at contracted economics would validate the $280M–$340M power CapEx spend |
| Q2 2026 earnings | ~August 2026 | Sequential production vs. guidance (925–975 MMcfe/d), CapEx burn rate ($155M–$215M guided), Power Adj. EBITDAX trajectory, any PPA update |
| FEED study completion (CO₂ capture at Temple) | 2026 | Validates technical feasibility of capturing emissions from the gas turbines directly; key for the long-term "closed loop" thesis |
| Summer ERCOT power demand | June–August 2026 | Heat-driven demand in Texas directly benefits BKV's Temple plants via spark spread expansion |
| $100M share buyback program | Ongoing (authorized Dec 2025) | Partial offset to dilution; pace of actual repurchases vs. authorization |
| FY2026 full-year results | ~February 2027 | Definitive read on whether the Power JV was accretive in its first full year of 75% ownership |
The bottom line on Pass #22
BKV passes all four hard filters — and the structural thesis is genuinely interesting: the only pure-play natural gas company in the series so far, with a vertically integrated platform from Barnett Shale wellhead through ERCOT power generation to underground CO₂ storage. The 11-analyst unanimous Strong Buy consensus and a 38–40% implied upside gap are among the strongest reads in the series.
The tension is between two real stories running in parallel. Bull case: BKV is building infrastructure (Power + CCUS + upstream consolidation) that will generate significantly higher cash flow in 2027–2028 once the CapEx cycle peaks; the current negative FCF is the price of that option, and a PPA signing with a hyperscaler would confirm the economics. Bear case: the stock has declined 22% in six weeks despite an earnings beat, every senior manager is selling shares near the 52-week range, consensus projects EPS declining 21.5% annually for three years, FCF is –$449M and getting worse before it gets better, and the Altman Z-Score sits in distress territory.
The two cases are not easily reconciled from the outside. The PPA negotiation process is the cleanest binary event to watch: if BKV signs a long-term power supply agreement with a data center operator or hyperscaler at economics that support the capacity build, the investment thesis gains a contractual foundation it currently lacks. If no PPA materializes and Q2 guidance is trimmed, the 40% analyst upside gap will narrow as targets get revised lower. At $25.06 — roughly $5 below book value on a simple per-share basis and with RSI approaching oversold — the stock is not expensive. Whether it is cheap depends on whether the next chapter of the story is titled "PPA signed" or "CapEx cut."
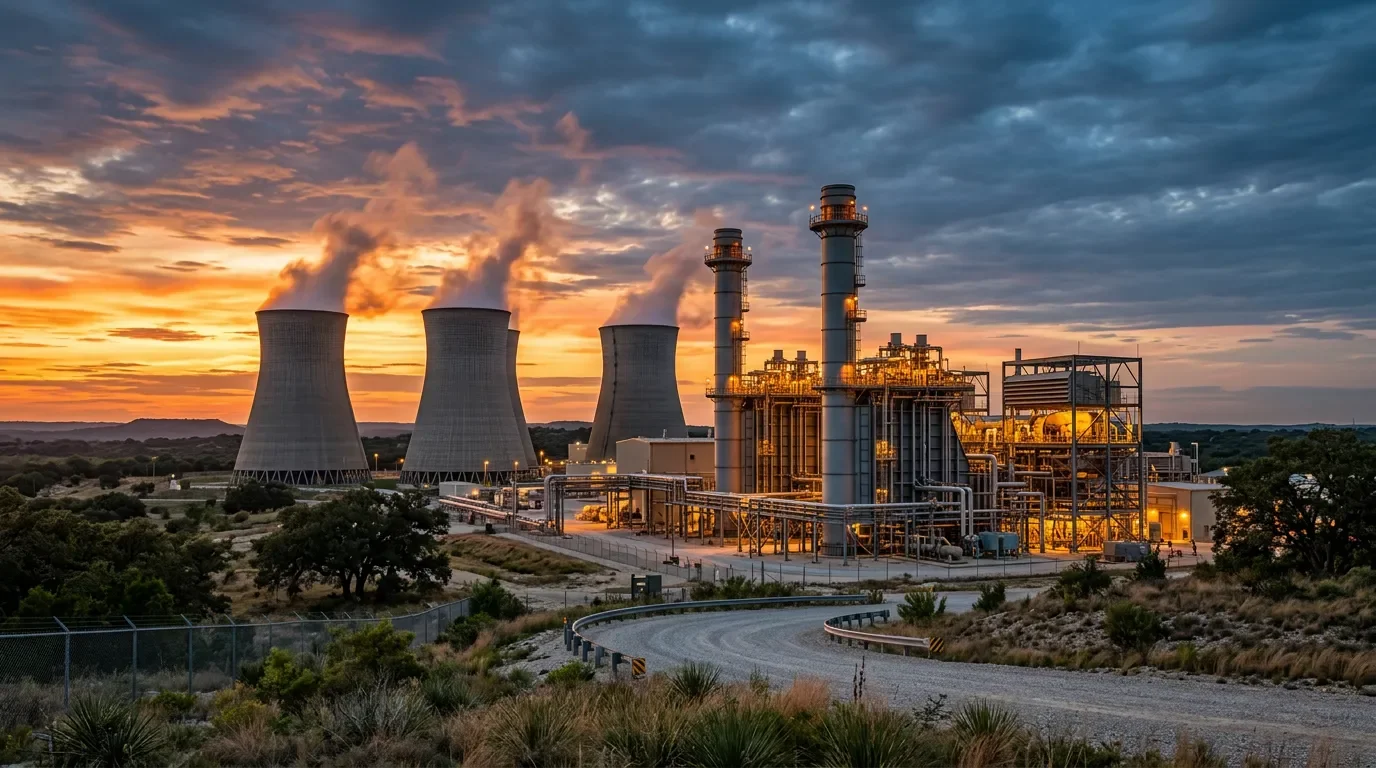
Cover image: AI-generated illustration.
References
- 1BKV Corp Stock Quote — Finviz
finviz.com
- 2BKV Corporation Statistics & Valuation — StockAnalysis
stockanalysis.com
- 3BKV Closes Bedrock Acquisition — BusinessWire
businesswire.com
- 4BKV Closes Power JV Acquisition — BusinessWire
businesswire.com
- 5BKV Q1 2026 Earnings Release — BusinessWire
businesswire.com
- 6BKV Revenue 2020–2026 — StockAnalysis
stockanalysis.com
- 7BKV Q4 & FY2025 Earnings — BusinessWire
businesswire.com
- 8
- 9Damodaran EV Multiples by Sector — NYU Stern
pages.stern.nyu.edu
- 10Simply Wall St: BKV Analysis
simplywall.st
- 11StockAnalysis: BKV Balance Sheet
stockanalysis.com
- 12BKV Analyst Ratings — Benzinga
benzinga.com
- 13
- 14
This story was produced automatically by a channel. One sentence is all it takes for Neodrop to keep producing for you.