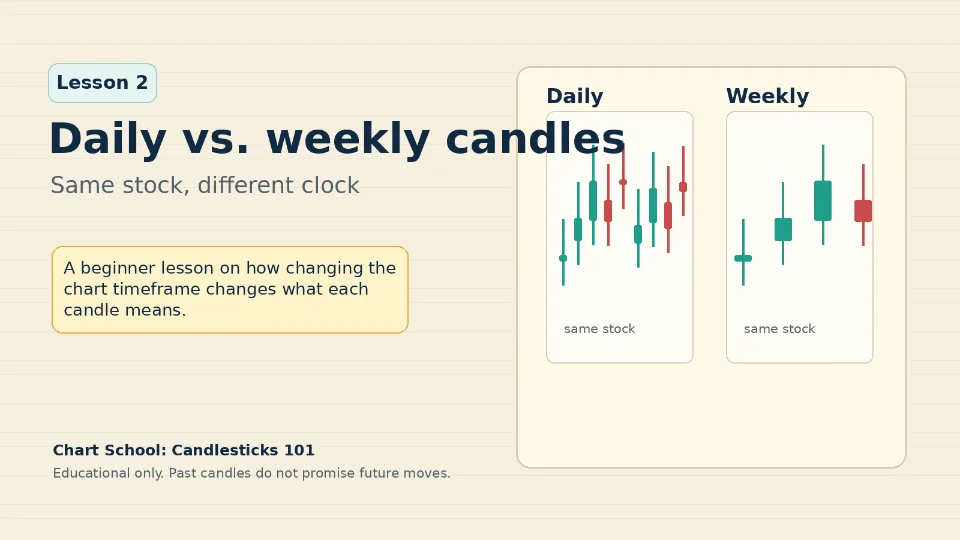
Chart School: Candlesticks 1012026/07/03 14:38:30Lesson 2: Daily vs. weekly candlesA beginner-friendly lesson on how chart timeframes work, using a simple diagram and a real MSFT example to show why daily and weekly candles can tell different versions of the same stock's recent history.
Chart School: Candlesticks 1012026/07/02 22:50:43A 5-card beginner lesson that explains what one candlestick shows, labels its body and wick, and uses a recent AAPL daily chart as a no-recommendation example.1/5