1/5
2026/7/2 · 14:50
Lesson 1: What a candlestick shows
A 5-card beginner lesson that explains what one candlestick shows, labels its body and wick, and uses a recent AAPL daily chart as a no-recommendation example.

This first deck teaches the basic building block of most stock charts: one candlestick. A candlestick chart uses a body and wick to show the open, close, high, and low for one chosen time period. 1
Swipe the 5 cards in order:
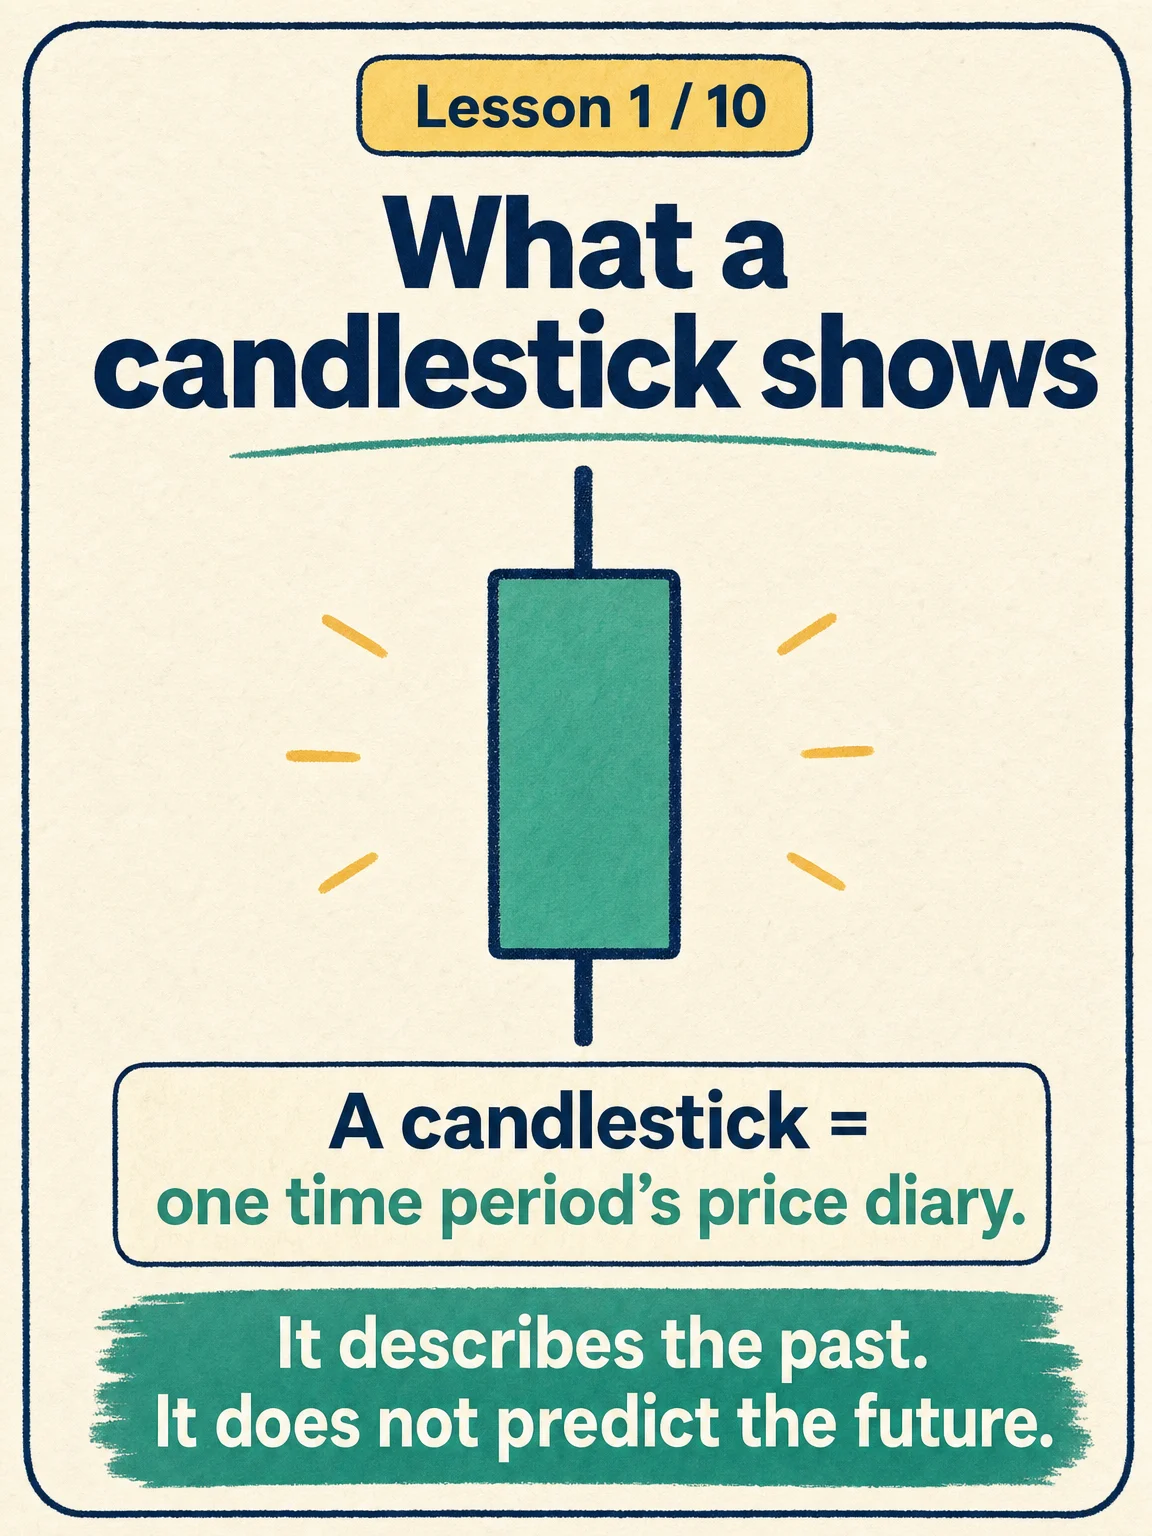
- Start with the plain-English idea: a candlestick is one time period's price diary.
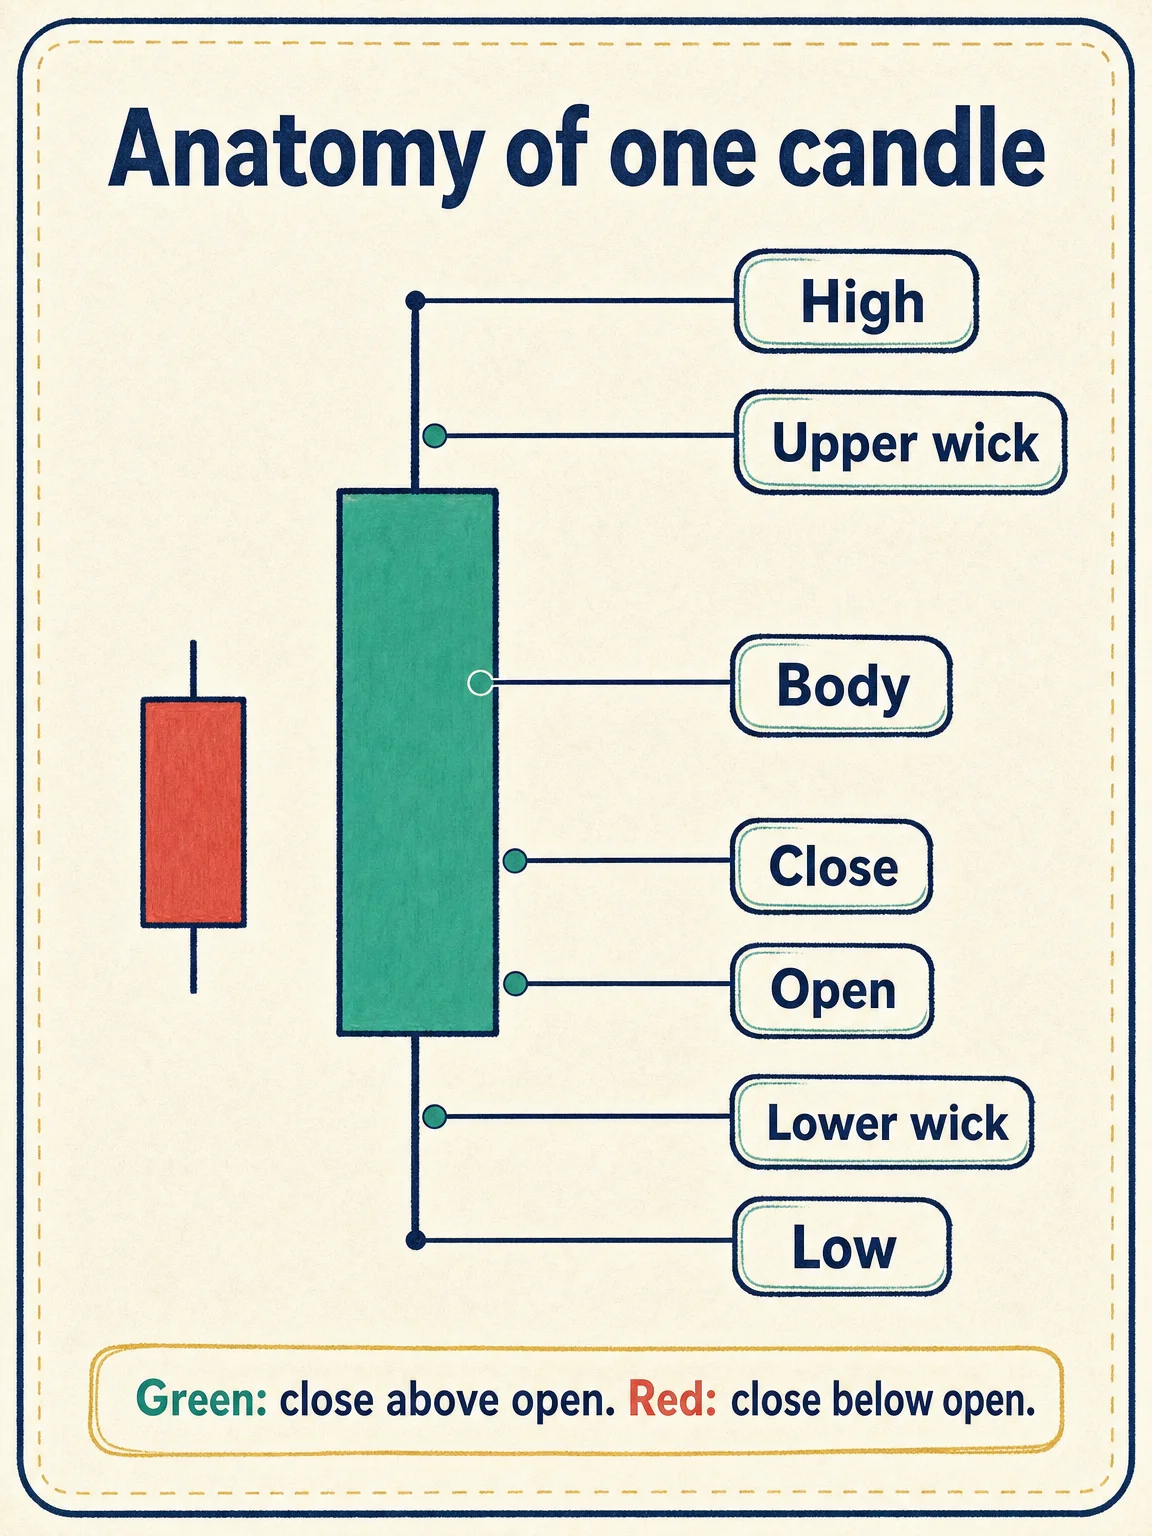
- Learn the anatomy: the body shows the open-to-close move, while the wick shows the high-to-low stretch. 2
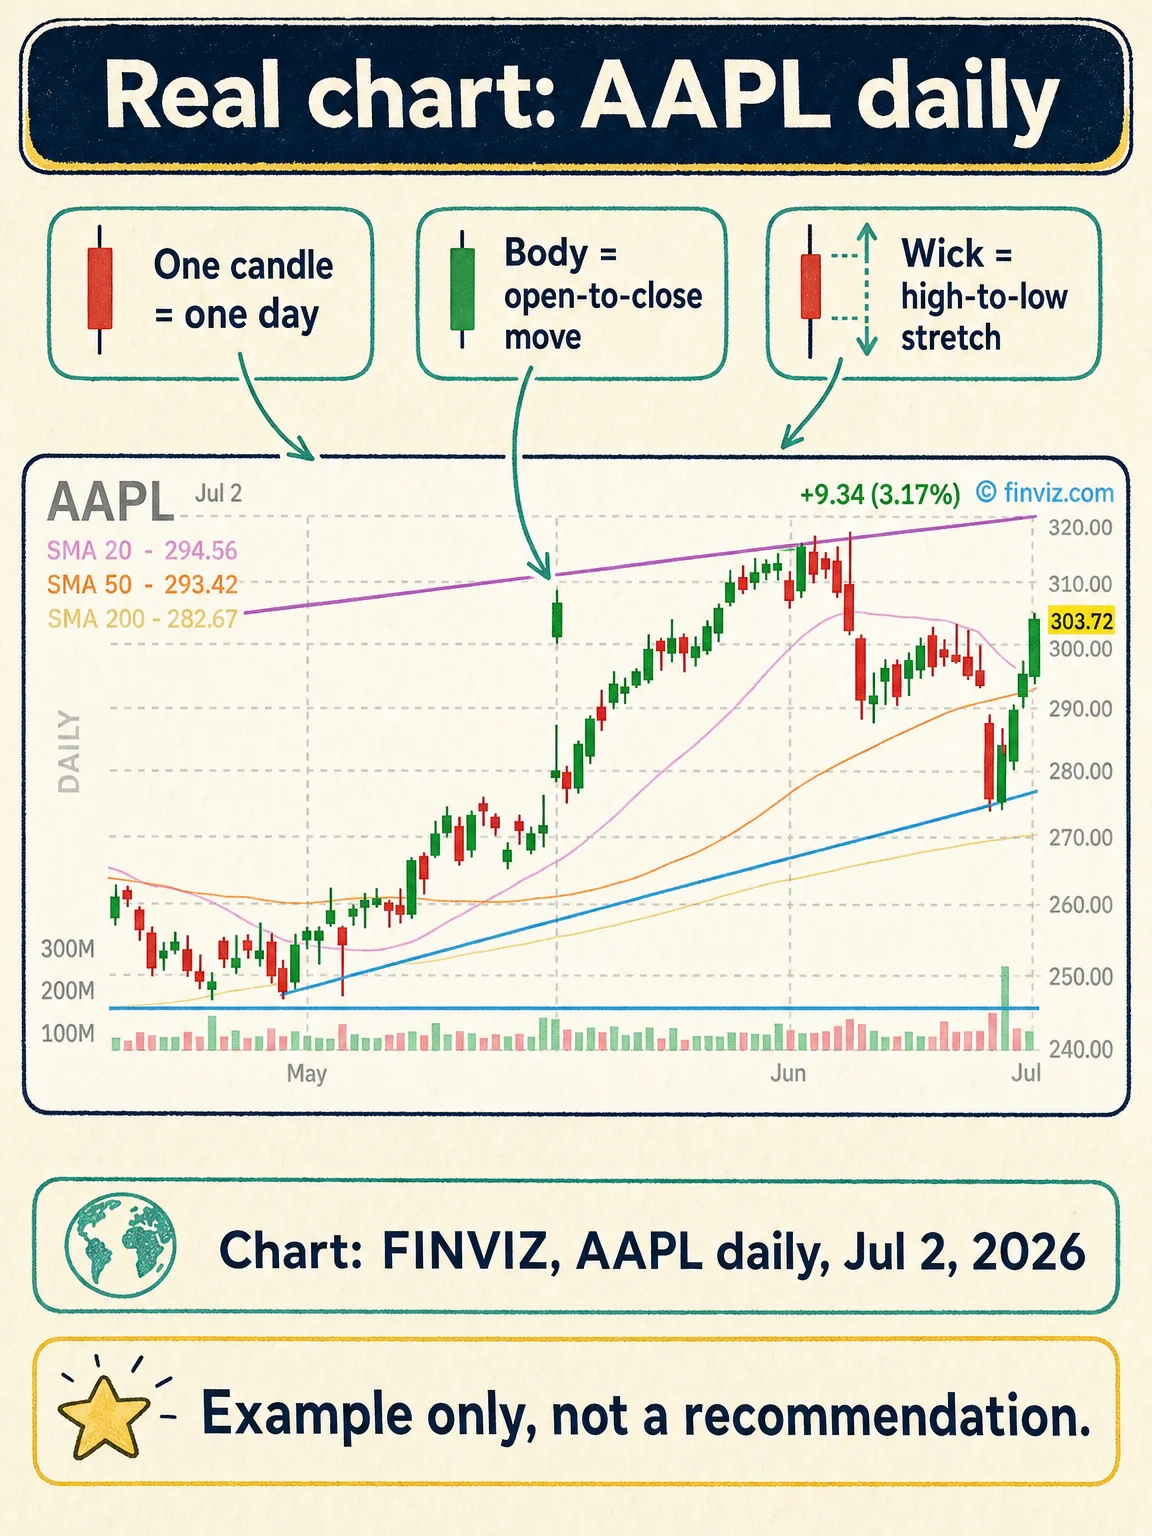
- See it on a recent AAPL daily chart from FINVIZ, used only as an example of how the shape appears on a real chart. 3
- Avoid the beginner trap: one candle is not a forecast.
- Place this lesson on the course ladder, then preview next week's daily-vs-weekly timeframe lesson.
Educational reminder: chart indicators describe past price action. They do not guarantee future results, and this lesson is not investment advice.
コメント
ログインするとコメントできます。