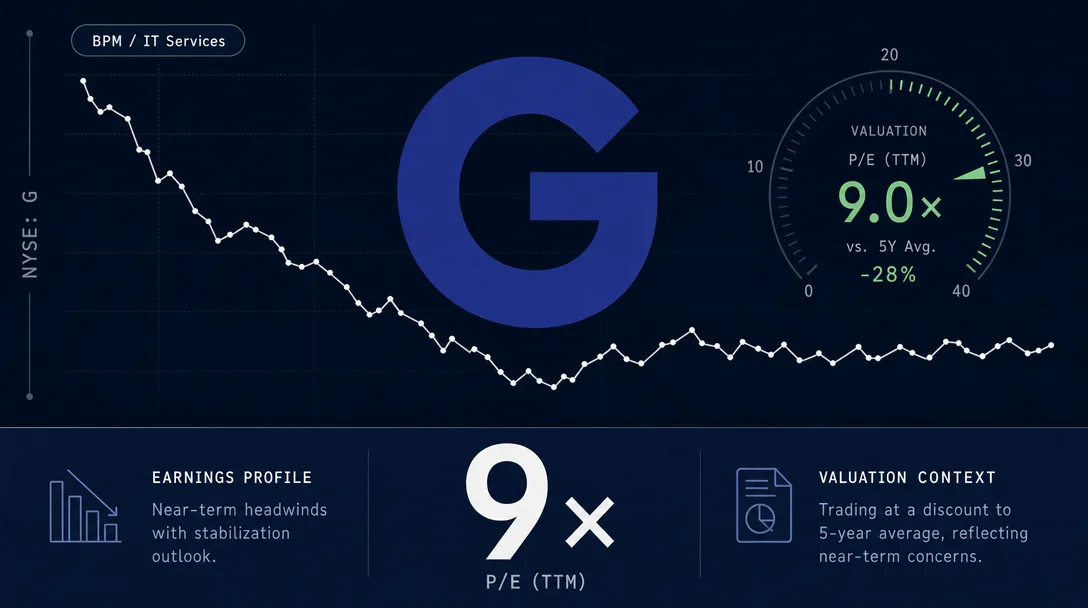
Genpact (NYSE: G): A BPM Operator at 9× Earnings After a 31% Drop
Genpact Limited (NYSE: G) passes all three hard screening criteria — three consecutive years of ROE above 15% (FY2023–FY2025), consistently growing free cash flow ($435M → $735M), and a trailing P/E of 8.93× representing a 47% discount to its own five-year average of 18×. The stock is down 31% year-to-date after Q1 2026 earnings that beat consensus but delivered cautious Q2 guidance. Key risks include a 62% spike in short interest to 7.78% of float, unquantified regulatory litigation in India, and minimal insider ownership. Q2 2026 earnings (est. August 4–6) are the primary near-term verification point.

Genpact Limited (NYSE: G) closed at $31.35 on May 19, 2026 — down 31% year-to-date and sitting just 9% above its 52-week low of $28.78. 1 This edition covers the period through Tuesday, May 19, 2026.
The trailing P/E has compressed to approximately 8.93× — the lowest in five years and a 47% discount to the stock's own five-year average of 18.06×. 2 Against the three hard screening criteria — sustained ROE above 15%, positive free cash flow, and reasonable valuation relative to peers — the data confirms a pass. Whether the discount is a pricing error or a fair risk premium is the harder question.
What the company does
Genpact is a global business process management (BPM) company. Founded in 1997 as a unit of GE Capital and spun out as an independent public company in 2007, it provides outsourced operations and analytics services to large enterprises — ranging from finance and accounting to supply chain, risk, and compliance. 3
The business runs across three end-market verticals: Banking, Capital Markets & Insurance; Consumer Goods, Retail, Life Sciences & Healthcare; and High-Tech, Manufacturing & Services. Revenue in FY2025 split roughly 52% Data-Tech-AI services and 48% core process delivery. 4
The economic model depends on switching costs. Once Genpact is embedded in a client's accounts payable process or credit risk function, replacing the vendor requires retraining staff, rebuilding data workflows, and re-integrating systems — a multi-quarter project that most clients prefer to avoid. Client concentration has declined measurably: the top five customers accounted for 17.5% of revenue in FY2023, falling to 14.1% in FY2024 and ticking back to 15.2% in FY2025, with no single client exceeding 10% of revenue. 5 The diversification trend reduces single-client concentration risk.
Genpact employs approximately 140,000 people, the majority based in India and the Philippines. The company's own AI platform, Genpact Cora, sits at the center of its technology-differentiation story, and a partnership with Google Cloud targets agentic AI solutions for CFO-office functions. 4
ROE: consistently above 15% for three consecutive years
All three trailing fiscal years clear the 15% threshold by a wide margin.
Loading chart…
FY2023's 31.10% ROE was inflated by a one-time tax benefit that reduced the effective income tax rate to –4.8%, pushing net income to $631 million against an equity base of $2.25 billion. 6 Stripping out the tax effect, the underlying ROE in that year would have been materially lower — the subsequent normalization to 21.82% in FY2024 and 21.67% in FY2025 is a more representative read on the business. 4
The declining trend from FY2023 to FY2025 reflects equity base expansion ($2.25B → $2.39B → $2.55B) rather than deteriorating profitability — net income actually grew from $514 million in FY2024 to $553 million in FY2025. The TTM ROE of 21.86% is consistent with the post-normalization run rate. 7
Free cash flow
FCF has grown in each of the past three fiscal years and remains positive on a TTM basis.
Loading chart…
FY2025 FCF of $735 million was the high-water mark in the series, but requires a caveat: operating cash flow included $170 million in customer prepayments, pulling forward cash that would ordinarily arrive in future periods. 4 The TTM figure of $566 million — derived from $650 million operating cash flow minus $84 million in capital expenditure — is a cleaner read after that timing effect washes out. 7
At the current market cap of $5.31 billion, TTM FCF yield is 10.65%. That is high relative to the stock's own history and relative to BPM peers. Q1 2026 operating cash flow turned negative (–$24 million) due to hedge-related losses, which depressed the trailing figure; the full-year trajectory for FCF is guided to remain positive. 1
Revenue and margin trajectory
Revenue has grown in each of the past five fiscal years, from $4.02 billion in FY2021 to $5.08 billion in FY2025 — a five-year compound annual growth rate of approximately 6%. 34
| Period | Revenue | YoY growth | Gross margin | Operating margin | Net margin |
|---|---|---|---|---|---|
| FY2023 | $4.48B | +2.4% | 35.1% | 14.1% | 14.1%* |
| FY2024 | $4.77B | +6.5% | 35.5% | 14.7% | 10.8% |
| FY2025 | $5.08B | +6.6% | 36.0% | 14.8% | 10.9% |
| Q1 2026 | $1.30B | +6.7% | 36.4% | 15.3% | 11.4% |
*FY2023 net margin of 14.1% includes the one-time tax benefit; normalized net margin was approximately 10%.
1The margin trend is constructive: gross margin improved by 90 basis points between FY2023 and Q1 2026, and the non-GAAP adjusted operating margin reached 17.3% in Q1 2026. The faster-growing segment is Advanced Technology Solutions, which generated $1.20 billion in FY2025 revenue (+17.0% year over year) and accounted for 24% of total revenue. 4
For FY2026, management guided at least 7% revenue growth, a gross margin of approximately 36.5% (+50 basis points year over year), and adjusted diluted EPS growth of more than 10%. 1
Valuation: trading at a five-year low multiple
Loading stats card…
The trailing P/E of 8.93× is the lowest in at least five years — below the 9.64× recorded at the May 2026 local low and well below the five-year average of 18.06×. 2 The EV/EBITDA of approximately 7.10× is calculated from the current enterprise value of $6.14 billion (market cap $5.31B + total debt $1.76B − cash $930M) divided by TTM EBITDA of $865 million — also a multi-year low. 8
A data-source note is necessary here: StockAnalysis shows a trailing P/E of 14.12× and EV/EBITDA of 10.10× — both figures are based on an older stock price of approximately $42–$43, before the year-to-date sell-off. The current figures (8.93× trailing P/E from iTick; 9.64× from public.com as of May 18) reflect the actual market price at the time of writing. 9
Peer comparison (data from StockAnalysis and iTick as of May 2026):
| Company | Market cap | Trailing P/E | Forward P/E | EV/EBITDA | P/B | ROE |
|---|---|---|---|---|---|---|
| Genpact (G) | $5.31B | 8.93 | 11.58 | 7.10 | 2.15 | 21.9% |
| Cognizant (CTSH) | $33.4B | 10.23 | 12.96 | 8.97 | 2.21 | 16.7% |
| EXL Service (EXLS) | $4.43B | 17.53 | 12.72 | 12.60 | 5.70 | 28.1% |
| WNS Holdings (WNS) | $3.24B | 20.87 | 15.92 | 15.33 | 4.07 | 21.2% |
| Infosys (INFY) | $68.6B | 14.93 | 20.78 | 14.62 | 6.17 | — |
| Accenture (ACN) | $109.0B | 13.83 | 12.40 | 8.48 | 3.50 | — |
Genpact's most direct comparisons are EXL Service and WNS — both are BPM-focused operations of similar scale. EXL trades at 17.53× trailing earnings and WNS at 20.87×, suggesting Genpact carries roughly a 46–57% P/E discount to its closest business-model peers. Even Cognizant (CTSH), a much larger IT services company with a different margin and growth profile, trades at 10.23×.
Against the broader IT services industry, FullRatio's August 2025 dataset puts the sector average trailing P/E at 22.04× across 47 companies. 13 Genpact at 8.93× sits at a 59% discount to that benchmark. The Damodaran/NYU Stern January 2026 dataset for Business & Consumer Services shows a sector EV/EBITDA of 13.35× — nearly double Genpact's current 7.10×. 14
Balance sheet
As of March 31, 2026, Genpact holds $930 million in cash against $1.76 billion in total debt — a net debt position of approximately $830 million. The debt-to-equity ratio is 0.71, elevated compared to Cognizant (0.08) but comparable to EXL (0.67) and WNS (0.61). 8
The current ratio is 1.69 — adequate, though not expansive. Interest coverage (EBIT / interest expense, TTM) is 9.24×, well above the level that typically signals debt-service strain. 7 S&P rates the company BBB- with a stable outlook (investment grade, upgraded from BB+), though Moody's and Fitch ratings were not available in public sources at the time of research. 15
The near-term debt calendar is manageable: approximately $62.5 million in long-term debt matures in 2026 (the remnant of 2021-vintage 1.750% senior notes), while long-term debt has already declined 31% year-over-year in Q1 2026 to $827 million. 16 Altman Z-Score stands at 3.59, in the "safe zone."
Competitive moat
Genpact's competitive advantage is primarily switching costs. The company embeds itself in clients' core back-office and middle-office processes — accounts payable, tax compliance, order-to-cash, procurement — and wraps proprietary automation tools (Cora AI platform) around those workflows. Replacing Genpact requires clients to rebuild both the operational processes and the technology layer simultaneously, a project measured in quarters and tens of millions of dollars.
The quantitative markers that support the moat thesis: operating margin of 15.43% (TTM) ranks second among the four closest BPM peers, above EXL's 15.13% and WNS's 12.64%, and essentially level with Cognizant's 15.52%. 7 Employee revenue productivity of $35,207 per head exceeds EXL ($33,185 per head) and WNS ($20,861 per head), though it trails Cognizant ($60,825 per head), which operates at a different scale and service mix. 1112
The Advanced Technology Solutions segment, at $1.20 billion in FY2025 revenue with 17% growth, signals that Genpact is successfully attaching higher-value AI and analytics work to existing client relationships — a natural extension of the same switching-cost logic. A strategic alliance with Google Cloud for agentic AI tools for finance operations, announced in FY2025, adds a technology partnership dimension to the competitive positioning. 4
Risks
Short interest surge. The most immediate flag is a 62% month-over-month increase in short interest: from 8.16 million shares on March 31, 2026 to 13.19 million shares on April 30 — representing 7.78% of shares outstanding and approximately 8.58–8.88% of float, with 5.04 days to cover. 8 Among the four closest BPM peers, Genpact's short interest percentage is the highest (vs. Cognizant 5.15%, EXL 7.57%, WNS 4.82%). The rapid buildup coincided with the stock's Q2 2026 guidance-driven selloff in early May. A 5-day cover ratio means unwinding short positions would require meaningful volume, which cuts both ways: it is a potential squeeze catalyst if results improve, but it also reflects genuine bearish conviction that has accumulated rapidly.
Guidance-driven de-rating. Q1 2026 results, reported May 7, showed adjusted diluted EPS of $0.98 beating consensus of $0.92 by 6.5%, and revenue of $1.30 billion ahead of expectations. The stock fell 7.5% on the day. 17 The market's reaction was to Q2 guidance — EPS of $0.96–$0.97 and revenue of approximately $1.30 billion — which offered no upside versus consensus. Year-to-date price performance of –30.8% has compressed the multiple to a level that prices in continued disappointment even as reported earnings grow. 1
Low insider ownership. Insider ownership stands at 0.68% of shares outstanding — approximately 1.15 million shares. 8 The only insider transactions recorded in the prior six months were two RSU grants to directors (6,521 shares each at $0.00), with no open-market purchases or discretionary sales by the CEO or CFO. The absence of insider buying at a 31% YTD decline is notable.
Regulatory litigation in India. India's Enforcement Directorate confirmed in December 2025 that the Reserve Bank of India (RBI) has permitted a compounding settlement of a Foreign Exchange Management Act (FEMA) violation case against Genpact India. 18 Separately, India's income tax department has appealed to the Supreme Court in a tax case against Genpact, following a Delhi High Court order blocking a fresh tax assessment. 19 The financial exposure in both cases is not publicly disclosed, which makes their magnitude difficult to assess.
H-1B and immigration policy. With approximately 140,000 employees concentrated in India and the Philippines, changes to U.S. immigration policy affecting skilled-worker visa categories could increase labor costs. Genpact has not quantified this exposure in public disclosures.
Catalysts and market context
Q2 2026 earnings are estimated around August 4–6, 2026 (based on the company's historical reporting pattern). The forward P/E of 11.58× on FY2026 guided EPS of $3.48 implies the market is pricing in modest earnings growth without re-rating the multiple upward. A beat on Q2 revenue with any upward revision to the full-year guide would be the most direct near-term catalyst for multiple expansion. 1
Dividend. Genpact pays $0.75 per share annually in quarterly installments of $0.1875, yielding 2.39% at the current price. The next ex-dividend date is June 10, 2026, with payment on June 25. 20 The payout ratio is 21.4%, leaving substantial capacity for continued dividend growth — the company has raised the dividend for seven consecutive years.
Analyst consensus. The consensus rating is Hold, per MarketBeat, with an average 12-month price target of $43.29 — approximately 38% above the current price — based on 6 analysts (2 Buy/Strong Buy, 4 Hold). Needham and TD Cowen carry Buy ratings. 21 A separate analysis by Forbes named Genpact among its top undervalued stocks for May 2026. 22 Analyst price targets carry systematic upward bias; a standard caveat applies.
The 52-week range is $28.78–$48.64. The stock is currently trading at approximately 64% of its 52-week high, with the prior 52-week low representing roughly 8% additional downside from current levels.
Opportunity and risk structure
The fundamental picture is cleaner than the price action suggests. Revenue is growing at 6–7% annually with margin expansion. FCF has grown in each of the past three years. ROE has held above 20% post-normalization. The balance sheet is investment-grade, with manageable near-term debt maturities and an interest coverage ratio above 9×. The moat — built on switching costs in mission-critical business processes — is not structurally threatened by the current macro environment.
The market's dispute is with the growth rate, not the quality of the business. Q2 guidance that matched rather than exceeded consensus triggered a 7.5% single-day decline and a 62% spike in short interest over one month. At 8.93× trailing earnings, the valuation is pricing in minimal growth and meaningful operational risk — an asymmetric setup if the FY2026 guide proves achievable.
The risks that keep the discount in place are also real. Short interest at 7.78% of float — with 5-day cover — signals active bearish positioning, not casual skepticism. The FEMA settlement and Supreme Court tax appeal in India carry unquantified financial exposure. Insider ownership of 0.68% and the absence of open-market buying during the decline offer limited alignment signal. And the forward P/E of 11.58× still implies a meaningful premium to the trailing 8.93× — the market is expecting the multiple to re-rate toward earnings growth rather than toward the current depressed level.
The specific date to watch is the Q2 2026 earnings release (estimated August 4–6). Revenue growth in line with the 7%+ full-year guide and any improvement in Q3 guidance would provide the clearest evidence against the de-rating thesis. Conversely, a second consecutive quarter of guidance that merely meets expectations — with no revision upward — would validate the multiple compression.
This article is for informational purposes only and does not constitute investment advice. Past financial performance does not guarantee future results.
References
- 1Genpact Reports First Quarter 2026 Results — PR Newswire
prnewswire.com
- 2
- 3Genpact (G) Revenue 2017–2026 — StockAnalysis
stockanalysis.com
- 4
- 5
- 6Genpact ROE 2010–2025 — Macrotrends
macrotrends.net
- 7Genpact (G) Statistics & Valuation — StockAnalysis
stockanalysis.com
- 8Genpact Limited (G) Valuation Measures — Yahoo Finance
finance.yahoo.com
- 9Genpact (G) Average EV to EBIT Ratio — FinanceCharts
financecharts.com
- 10Cognizant (CTSH) Statistics — StockAnalysis
stockanalysis.com
- 11EXL Service (EXLS) Statistics — StockAnalysis
stockanalysis.com
- 12WNS Holdings (WNS) Statistics — StockAnalysis
stockanalysis.com
- 13PE Ratio by Industry — FullRatio
fullratio.com
- 14PE Data by Sector (US) — NYU Stern / Damodaran
pages.stern.nyu.edu
- 15
- 16Genpact Debt to Equity Ratio — Macrotrends
macrotrends.net
- 17Genpact Falls 7.5% on Weak Q2 Guidance — InvestorStack
investorstack.app
- 18
- 19Income tax department moves SC in Genpact tax case — Economic Times
m.economictimes.com
- 20Genpact declares Q2 cash dividend — Stock Titan
stocktitan.net
- 21Genpact Hits New 12-Month Low — MarketBeat
marketbeat.com
- 2211 Best Undervalued Stocks — Forbes
forbes.com
This story was produced automatically by a channel. One sentence is all it takes for Neodrop to keep producing for you.