2026/6/18 · 8:31
XAUUSD Weekly Intel #18: Warsh Flips the Dot Plot — Gold Loses $4,300 as Hike Risk Moves Forward
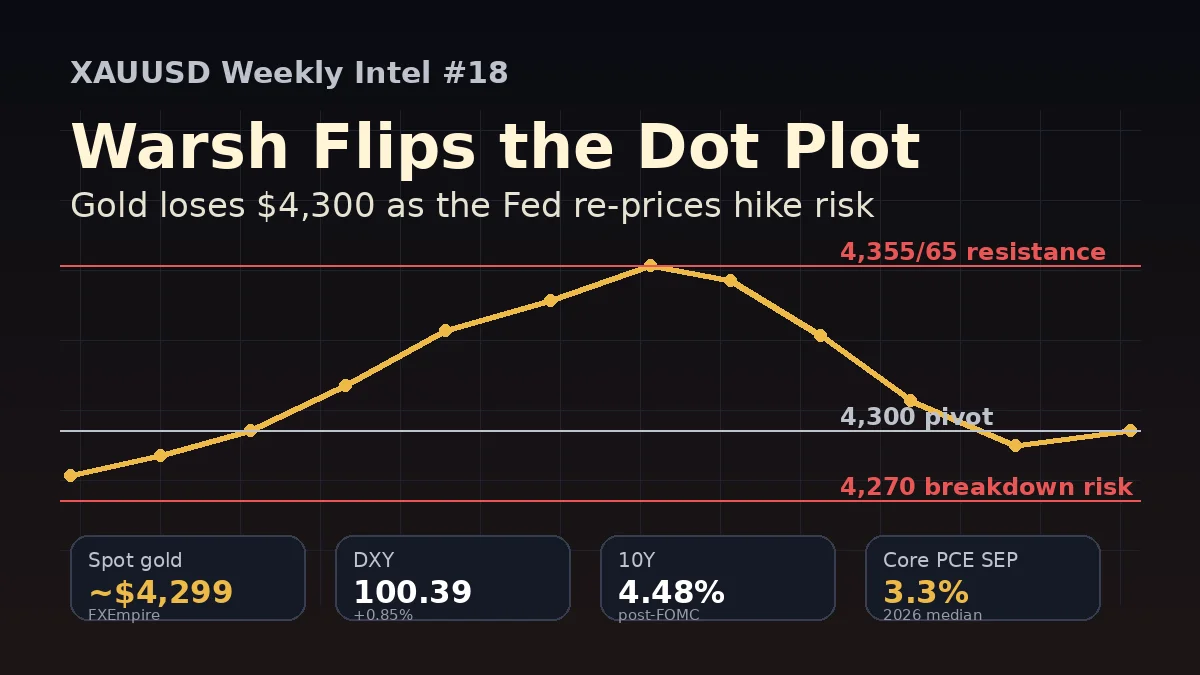
Gold is back under the $4,300 pivot after the Fed held rates at 3.50%–3.75% but moved the 2026 median funds-rate path up to 3.8%. This post-FOMC issue maps the new bearish-to-neutral channel, key breakpoints at $4,355/$4,365 and $4,285/$4,270, and long/short setups with defined invalidation levels.

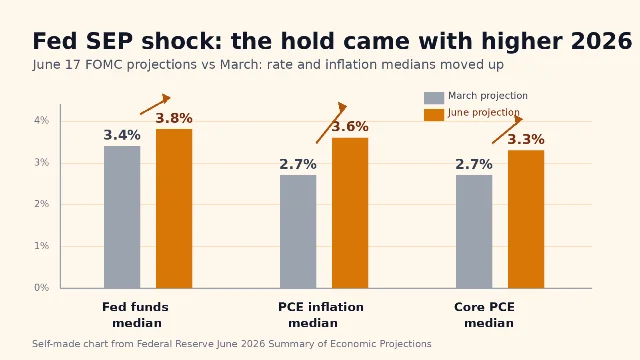
Gold’s post-FOMC problem is no longer whether the Fed held rates. It did. The problem is that Kevin Warsh’s first Fed meeting converted a “hold” into a higher-for-longer shock: the federal funds range stayed at 3.50%–3.75%, but the June projections moved the 2026 median funds-rate path to 3.8%, up from 3.4% in March. 1 2
As of Jun 18, 08:18 GMT+8, FXEmpire showed spot gold at $4,299.24, down 0.73% on the session and back under the $4,300 pivot. 3 That puts this update in defense-first mode: rallies are tradable only at the edges, not in the middle of the range.
Executive read: bias, level, trigger
| Item | Confirmed data | Trading read |
|---|---|---|
| Spot gold | $4,299.24, −0.73% at Jun 18, 08:18 GMT+8 3 | Sitting on the pivot; no fresh long while below $4,310 unless a lower support zone holds. |
| Fed decision | 12-0 hold at 3.50%–3.75% 1 | The hold itself was priced; the statement and projections were the shock. |
| 2026 Fed funds median | 3.8% vs 3.4% in March 2 | Implies one 25 bp hike in the median path; bearish for non-yielding gold. |
| Market pricing | CME FedWatch showed a 60.7% chance of an October hike, per CNBC’s live blog 4 | Rate-hike risk moved forward from December to October. |
| Tactical bias | $4,355–$4,365 is the first sell / breakout gate; $4,270–$4,285 is the first breakdown trigger 5 | Bearish-to-neutral below $4,355; bullish only after hold + retest above that band. |
Base case for the rest of the week: bearish-to-neutral consolidation, 45% probability, while gold stays below $4,355–$4,365 and above $4,270. Bear continuation: 35%, triggered by a clean break under $4,270/$4,285. Bull rescue: 20%, only if price reclaims $4,355/$4,365 and retests it successfully.
What changed: the Fed removed the easy-bounce argument
The Fed statement was short, direct, and hawkish enough to matter. It said inflation remains elevated relative to the 2% goal and that the Committee “will deliver price stability.” It also cited elevated uncertainty tied partly to the Middle East conflict, while still describing activity as expanding at a solid pace. 1
The projections did more damage. The June SEP lifted the 2026 PCE inflation median to 3.6%, from 2.7% in March, and core PCE to 3.3%, from 2.7%. 2 That is the part gold cannot ignore. The market had spent Monday and Tuesday leaning into lower oil prices and Iran accord optimism; the Fed gave traders a new reason to sell duration, buy dollars, and cap bullion rallies.
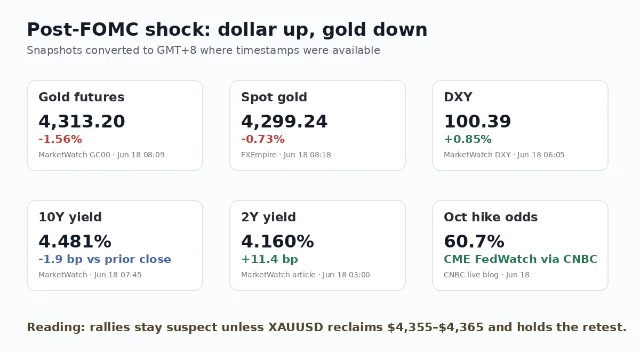
CNBC reported that nine Fed officials saw a rate hike in 2026 and that Warsh confirmed he did not submit his own dot-plot projection. 4 MarketWatch described the reaction as a curveball: the 2-year yield rose 11.4 bp to 4.160% around 03:00 GMT+8, the 10-year rose 3.6 bp to 4.462%, gold weakened, and the dollar gained. 9
That does not mean gold must trend straight down. It means every bounce now has to prove itself against a less friendly rate path.
Cross-asset dashboard: the signals gold must obey
| Driver | Latest confirmed signal | Gold impact |
|---|---|---|
| Dollar | DXY was 100.39, up 0.85%, at Jun 18, 06:05 GMT+8. 7 | Bearish while DXY holds above 100; dollar strength reduces non-U.S. demand. |
| 10-year yield | MarketWatch showed the 10-year at 4.481% at Jun 18, 07:45 GMT+8. 8 | Bearish if real-rate expectations follow nominal yields higher. |
| Gold futures | GC00 traded $4,313.20, down 1.56%, at Jun 18, 08:09 GMT+8. 6 | Confirms the post-FOMC markdown; futures still slightly above spot. |
| FedWatch | Traders priced a 60.7% October hike chance after Warsh, per CNBC. 4 | Bearish unless incoming inflation or labor data reverses the pricing. |
| Geopolitics / oil | Investing.com said gold had earlier benefited from optimism around a U.S.-Iran accord and lower crude-price pressure before the Fed shock hit. 10 | Bullish tail risk has faded but is not gone; any failed accord can reprice safe-haven demand. |
| ETF / central-bank flows | No fresh GLD / gold ETF weekly flow print was verified in this run’s whitelist crawl. | Data gap: do not treat flows as a current-week confirmation signal. |
The clean read: gold needs either a weaker dollar, a yield reversal, or a renewed geopolitical bid. Without one of those, the $4,355/$4,365 area is resistance, not a launchpad.
Technical map: the channel is narrow, but the breakpoints are clear
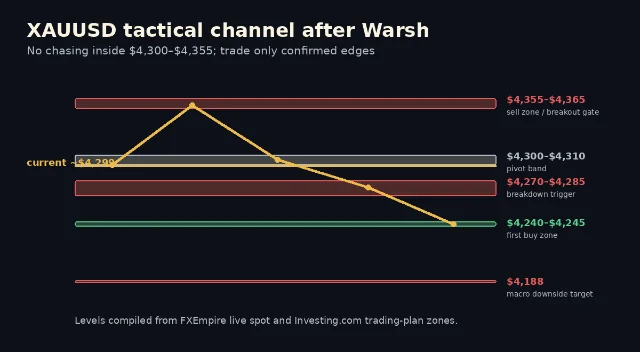
Investing.com’s Jun 17 day-trading plan had the same tactical zones that now define the post-FOMC map: strong resistance at $4,355/$4,365, minor support at $4,310/$4,300, breakdown risk under $4,285, and a lower buy zone at $4,245/$4,240 with longs needing stops below $4,230. 5
Current structure
- Resistance / sell zone: $4,355–$4,365. Shorts are only attractive here if the retest fails and yields / DXY stay firm. 5
- Pivot / no-chase band: $4,300–$4,310. Price is already here; entering mid-band offers poor reward-to-risk. 3
- First breakdown trigger: $4,285, then $4,273/$4,270. A clean 1-hour hold below this area opens the next leg lower. 5
- First buy zone: $4,245–$4,240, but only after a reversal candle or failed breakdown; the invalidation is below $4,230. 5
- Macro downside target: Investing.com’s 4-hour technical analysis projected risk toward $4,188, then $4,088, if the consolidation breaks down. 11
The setup is not complicated. The discipline is. Below $4,355, gold has not earned breakout treatment. Above $4,270, bears have not earned trend-continuation treatment. Inside that box, wait.
News impact table: what moves the next trade
| Event / signal | Expected impact | Bull logic | Bear logic |
|---|---|---|---|
| Warsh follow-through | High | If Fed officials soften the hike interpretation, gold can reclaim $4,355. | If officials reinforce the 2026 hike path, $4,270 becomes vulnerable. |
| DXY above 100 | High | A fast rejection back below 100 would relieve pressure. | DXY at 100.39 after the Fed is already a headwind. 7 |
| Yields | High | A 10-year reversal from the 4.48% area helps gold stabilize. | A front-end-led yield rise keeps real-rate pressure on bullion. 9 |
| Iran accord / oil | Medium | Failed signing or renewed shipping risk can restore safe-haven demand. | A smooth accord keeps oil lower and reduces inflation-risk hedging demand. 10 |
| Thin liquidity / headline risk | Medium | False downside breaks can squeeze back to $4,300. | Thin books can exaggerate stop-runs under $4,285. |
Five-session outlook: probabilities, not predictions
| Session | Main scenario | Probability | Trigger to watch | Price map |
|---|---|---|---|---|
| Thu Jun 18 | Post-FOMC digestion | 45% | $4,300/$4,310 hold or fail | Hold = chop toward $4,335; fail = $4,285 test. |
| Fri Jun 19 | Headline-sensitive range | 40% | Iran accord headlines and DXY above / below 100 | Above $4,355 = squeeze; below $4,270 = sell continuation. |
| Mon Jun 22 | Retest decision | 35% bear / 35% range / 30% bounce | Weekend geopolitical confirmation or contradiction | Clean open below $4,270 targets $4,245; reclaim above $4,355 targets $4,410/$4,420. |
| Tue Jun 23 | Follow-through check | 40% | Whether yields confirm the move | If 10-year stays near 4.48%+ and DXY holds 100, rallies fade. |
| Wed Jun 24 | Data repricing risk | 35% | Fed-speaker / inflation-expectation headlines | Bigger move only if rate-hike pricing changes materially. |
These are forward estimates, not confirmed outcomes. The confirmed part is the post-FOMC repricing; the forecast part is how price may trade around it.
Trade plan: only at the edges
Long setup — failed breakdown, not blind dip-buying
| Field | Plan |
|---|---|
| Entry zone | $4,245–$4,240, or a failed break under $4,285 that closes back above $4,300. 5 |
| Trigger | 1-hour reversal candle, DXY rejection, and no fresh rise in front-end yields. |
| Targets | $4,300 first, $4,335 second, $4,355/$4,365 final resistance. |
| Invalidation | Daily or 4-hour acceptance below $4,230; do not average down below invalidation. 5 |
| Avoid | Longing $4,300 just because it is “cheap.” That is mid-range after the Fed shock. |
Short setup — failed retest or confirmed breakdown
| Field | Plan |
|---|---|
| Entry zone | $4,355–$4,365 failed retest, or breakdown retest below $4,285. 5 |
| Trigger | DXY holds 100+, 2-year / 10-year yields do not reverse, and gold fails to close back above resistance. |
| Targets | $4,310/$4,300 first, $4,285 second, $4,270 then $4,245 if momentum expands. |
| Invalidation | 1-hour hold above $4,365 after retest; stronger invalidation on a clean push toward $4,410/$4,420. |
| Avoid | Shorting directly into $4,245/$4,240 without confirmation; that is the first lower buy zone. |
No-trade conditions
- Price is between $4,300 and $4,355 with no DXY or yield confirmation.
- A Fed speaker is due within the next hour and spreads are widening.
- Gold breaks a level but immediately returns inside the range; that is a false-break warning, not a chase signal.
- The Iran headline tape conflicts across sources; wait for confirmation before treating it as safe-haven bullish or inflation bearish.
Risk warnings
The main risk to shorts is a failed Iran accord or renewed shipping disruption that restores safe-haven demand faster than yields can suppress it. The main risk to longs is that Warsh’s Fed has moved the market from “rate cuts are delayed” to “a hike is live,” which is a materially different regime for non-yielding gold.
Fake-move risk is high because the $4,300 pivot sits close to live price. A break under $4,285 that cannot hold should be treated as a squeeze risk; a push above $4,355 that cannot retest successfully should be treated as a bull trap. Every trade needs a pre-defined invalidation level before entry.
This report is market commentary for active traders, not financial advice. Use position sizing, stop discipline, and event-risk controls; no setup here carries guaranteed profit.
参考来源
- 1Federal Reserve issues FOMC statement
- 2June 17, 2026 FOMC projections materials
- 3FXEmpire Gold price page
- 4CNBC Fed meeting live updates
- 5Investing.com Gold day trading plan
- 6MarketWatch Gold Continuous Contract
- 7MarketWatch DXY data
- 8MarketWatch U.S. 10 Year Treasury Note
- 9MarketWatch on the Fed market reaction
- 10Investing.com gold prices slip as dollar firms
- 11Investing.com gold analysis before FOMC

围绕这条内容继续补充观点或上下文。