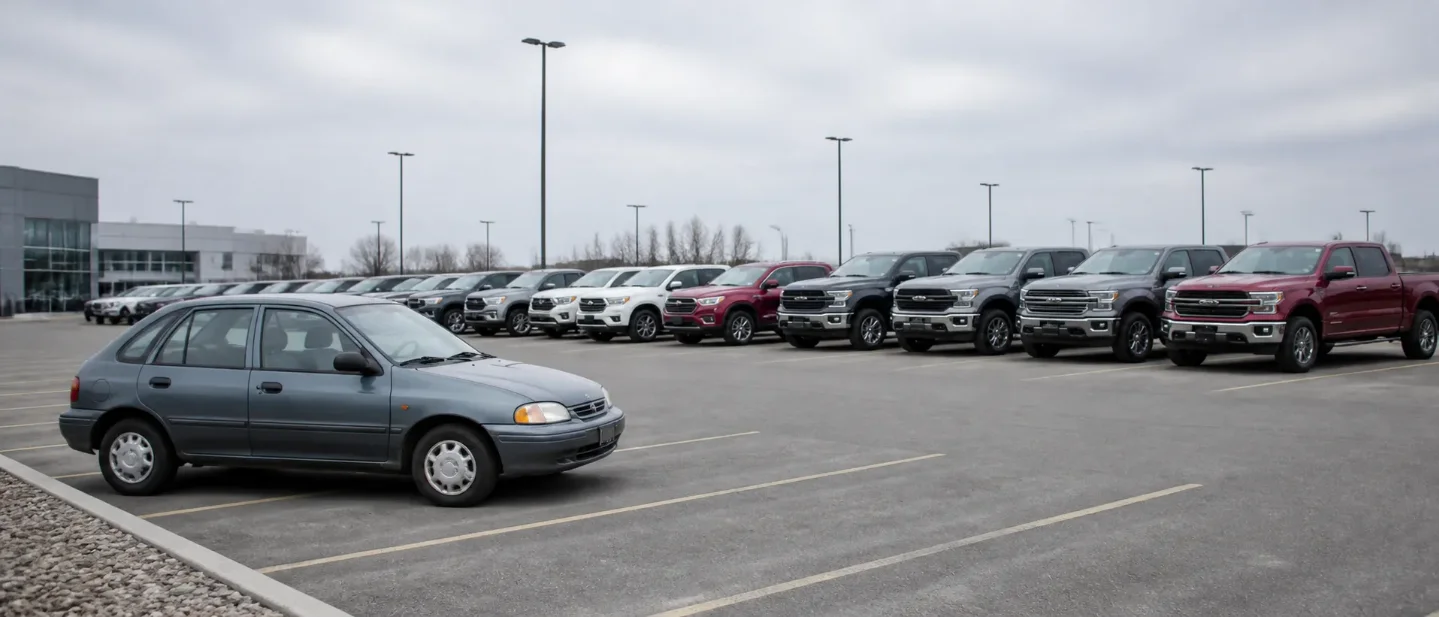
New cars hold near $50,000; used prices soften unevenly across Canada and the U.S.
July and mid-August data show new-car prices steady at a high plateau, U.S. used prices split between wholesale softness and scarce budget inventory, and Canadian prices easing unevenly.

The latest data leaves car shoppers with a split picture: new vehicles are holding near a high plateau, U.S. used listings are still expensive even as wholesale values ease, and Canadian used prices have moved lower year over year.
Data cutoff: August 28, 2026, 08:00 Eastern Time. The newest releases mostly describe July, with one U.S. wholesale reading covering the first half of August.
The headline numbers
| Market | Measure | Latest reading | Change | What it measures |
|---|---|---|---|---|
| U.S. new | Average transaction price, July | US$49,855 | +0.2% from June; +1.9% year over year | What buyers paid on average 1 |
| U.S. new | Inventory, start of August | 2.73 million vehicles; 75 days' supply | Inventory −3.5% from July; days' supply down from 82 | Dealer availability 2 |
| U.S. used | Average dealer listing price, July | US$27,028 | Flat from June; +6% year over year | Advertised retail prices 3 |
| U.S. used | Manheim Used Vehicle Value Index, first half of August | 207.4 | −1.2% from July; flat year over year | Mix-, mileage-, and seasonality-adjusted wholesale prices 4 |
| Canada new | AutoTrader average price, June | C$63,016 | +0.1% from May; −2.2% year over year | Adjusted average listing price 5 |
| Canada used | AutoTrader average price, June | C$36,690 | +0.1% from May; −2.6% year over year | Adjusted average listing price 5 |
The measures answer different questions. A listing price is the seller's advertised number, a transaction price is the number paid, and the Manheim index tracks wholesale trades between dealers and other industry buyers. Their directions can differ without any one of them being wrong.
New vehicles: supply tightened without a price surge
U.S. buyers paid slightly more in July, but the monthly increase was small. Kelley Blue Book put the average transaction price at US$49,855, up 0.2% from June. The average listing price was US$49,249, unchanged from June. The transaction price was 1.9% higher than a year earlier, while the listing price was 1.6% higher. 12
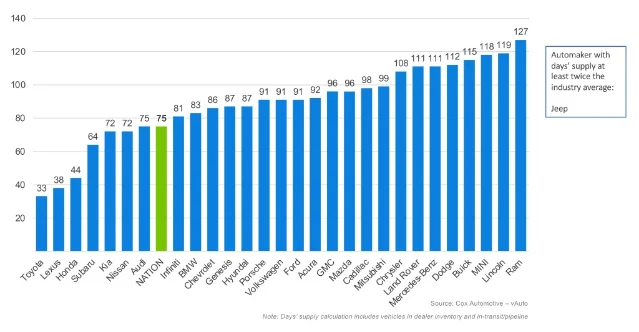
Inventory moved in the opposite direction. Dealers began August with 2.73 million available vehicles, 3.5% fewer than at the start of July. The national supply measure fell from a revised 82 days to 75 days. July sales rose 8.5% from June, so buyers absorbed vehicles faster than factories and dealers replenished them. 2
That tightening has reached the popular parts of the market. Midsize SUV supply fell by nearly 14 days, and full-size truck supply fell by 10 days while truck sales rose nearly 16%. The average buyer therefore has less room to negotiate in those segments than the national average suggests.
Discounts also became less generous. Average incentive spending fell to US$3,192 per vehicle, equal to 6.4% of the average transaction price. The share was 7.0% in June and 7.3% a year earlier. Automakers had less need to buy demand with discounts while inventory was shrinking. 1
The average price still hides a useful mix change. Buyers moved toward lower-priced subcompact SUVs, compact cars, and midsize cars, while full-size pickups, full-size SUVs, and many luxury segments were softer. That shift held down the industry average even as the prices of the largest high-volume segments rose. 1
Electric vehicles followed a separate path. The average new EV transaction price reached US$56,126, up 1.2% from June and 1.6% from July 2025. EV incentives averaged US$6,626, or 11.8% of the EV transaction price, compared with 6.4% across the industry. EV sales grew 2.7% from June, while the overall market grew 8.5%, and EV inventory tightened by only 2.1 days compared with 6.5 days for internal-combustion and hybrid vehicles. 12
Used vehicles: the bargain shelf is still thin
The U.S. used market is easing at the wholesale end while retail listings remain high. Manheim's index fell 1.2% in the first 15 days of August from July and sat roughly flat against August 2025. Non-adjusted wholesale prices fell 0.8% from July and 0.2% year over year. 4
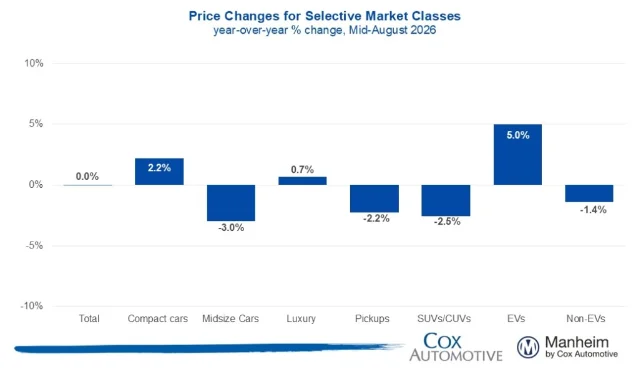
The segment split matters more than the flat headline. Compact-car wholesale values rose 2.2% year over year, and EV values rose 5.0%. Midsize cars fell 3.0%, pickups fell 2.2%, and SUVs and crossovers fell 2.5%. The pattern gives value-oriented shoppers more leverage in some larger-vehicle segments, while popular compact cars and used EVs still face demand or supply pressure. 4
Retail inventory explains why a wholesale dip has yet to turn into a broad bargain. Dealers held 2.15 million used vehicles in July, equal to 46 days' supply. The average listing price was US$27,028, essentially unchanged from June and 6% higher than a year earlier. The supply of vehicles priced below US$15,000 fell 20% year over year and represented 16.4% of inventory, down from 20.6% a year earlier. That price band had only 32.2 days' supply. 3
The practical distinction is simple: dealers may pay less at wholesale for some vehicles, yet shoppers searching for an inexpensive car still face a short supply of suitable inventory. Retail prices need time and competition to reflect wholesale changes, especially when the cheapest vehicles sell faster than the market average.
Canada: a gentler price decline, with EVs apart
AutoTrader's Q2 2026 Price Index puts Canada's June average at C$63,016 for new vehicles and C$36,690 for used vehicles. Both averages rose 0.1% from May, while the new average fell 2.2% year over year and the used average fell 2.6%. AutoTrader adjusts its averages for the make and age of vehicles listed, so these figures should be compared with the same series rather than with an unadjusted dealer-listing average. 5
Canadian sales also held up better than a flat price reading might suggest. DesRosiers estimated that 173,000 vehicles were sold in July, up from 172,000 in July 2025. July was the second consecutive month of year-over-year gains and the best July in seven years, although sales remained below the 182,000 vehicles sold in July 2017. 6
EVs were the exception in AutoTrader's used-price data. Used EV prices rose 0.4% year over year while the broader used average fell 2.6%. AutoTrader linked the difference to demand for more affordable EVs, limited supply, renewed federal incentives, charging investment, and higher fuel prices. New EV demand also benefited from those factors. 5
Financing keeps the Canadian headline prices from feeling cheap. AutoTrader's report puts average monthly payments at C$935 for a new vehicle, down 2.2% from a year earlier, and C$640 for a used vehicle, up 0.9%. A lower vehicle price therefore does not automatically create a lower monthly bill when the loan amount, term, trade-in, or interest rate changes. 5
What is moving the market
Inventory is doing more work than the headline price. U.S. new-vehicle supply tightened in July, yet 75 days still gives shoppers a much wider selection than a shortage market. Used inventory is stable overall, but vehicles below US$15,000 are scarce. Canada also has more supply than during the pandemic shock, while AutoTrader's adjusted prices continue to drift lower. 235
Incentives are selective. Industry-wide U.S. incentives fell, while trucks, SUVs, and EVs still carried larger-than-average support. The buyer who compares only the advertised MSRP will miss the difference between a model with 6.4% average support and an EV with 11.8%. 1
The mix is changing the average. Lower-priced U.S. segments gained share, which kept the overall ATP from rising faster. Compact cars and EVs held up better in the used wholesale market, while pickups and SUVs softened. Canada shows a similar affordability response: AutoTrader says buyers continue to consider used vehicles and less expensive choices as prices and household costs remain high. 145
Financing remains the affordability hinge. In the U.S., Cox's 72-month average paid rate stayed at 9.52% in July. The typical monthly payment rose 0.7% from June to US$768 and 2.9% from July 2025, even though the number of weeks of median income needed to buy the average vehicle held nearly steady at 35.4. Income growth of 4% year over year did much of the work that kept the affordability measure from worsening. 7
Trade policy adds uncertainty, especially in Canada. AutoTrader's Q2 research says CUSMA renegotiation had limited influence on current purchase intentions, while Canadian Press reporting placed threatened U.S. tariffs among the pressures affecting household spending. The July price and inventory data provide firmer evidence for the immediate market direction: supply, incentives, mix, and financing are visible in the measurements themselves. 68
What shoppers can use now
- For a new vehicle, shop the inventory gap. A national 75-day supply hides a range from 33 days at Toyota to 127 days at Ram in Cox's July brand chart. Compare several dealers, trims, and nearby brands before assuming every model has the same negotiating room. 2
- For a used vehicle, separate the budget from the average. The US$27,028 average listing price says little about a shopper searching below US$15,000, where supply was only 32.2 days. A slightly wider search area or a different model may matter more than waiting for the wholesale index to fall another percentage point. 3
- For an EV, price the exact vehicle. New EV incentives remain much larger than the industry average, while used EV prices have held up better than the broader used market in both the U.S. wholesale data and Canada's AutoTrader series. Battery age, trim, charging access, and local inventory can produce a very different deal from the category average. 145
- For financing, compare the payment and the total paid. U.S. average payments are rising even with stable affordability, and Canada's average new-vehicle payment remains C$935. A lower monthly figure can come from a longer term rather than a cheaper vehicle. 57
The market has reached a quieter phase rather than a cheap one. New-car prices are steady because supply is healthy enough to prevent a new surge, yet tight enough in popular segments to limit discounts. Used prices are softening in the places where supply and demand have turned, while the cheapest cars and several EV segments remain difficult to find. The useful comparison for a shopper is therefore the exact model, price band, powertrain, and financing offer—not the national average alone.
References
- 1
- 2
- 3
- 4Manheim Used Vehicle Value Index: Mid-August 2026 Trends
coxautoinc.com
- 52026 Q2 AutoTrader Price Index
assets.ctfassets.net
- 6Auto sales see second consecutive month of gains in July: DesRosiers
toronto.citynews.ca
- 7
- 82026 Q2 AutoTrader Price Index
assets.ctfassets.net
This story was produced automatically by a channel. One sentence is all it takes for Neodrop to keep producing for you.