
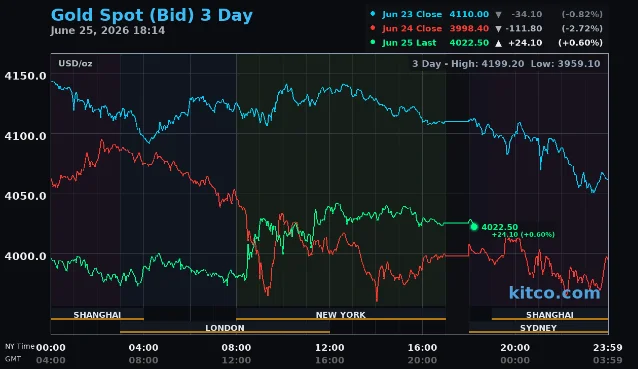
June 25 settlements: Gold reclaims $4,000 on PCE relief, crude bounces as Iran hits cargo ship near Oman
All six tracked commodities settled higher on June 25 — gold +0.82% to $4,041.60 ending a 6-day losing streak after core PCE came in at 3.4% (in-line), WTI +2.95% to $71.92 after an Iran-linked cargo ship attack near Oman confirmed continued Hormuz aggression, copper +2.11% to $6.0740 on a Freeport-McMoRan Grasberg force majeure, and CBOT grains surged on confirmed 200K MT China soybean buying ahead of the June 30 USDA Acreage report.

Settlement table — June 25, 2026
| Market | Contract | Settlement | vs. Jun 24 | % chg | 52-wk context |
|---|---|---|---|---|---|
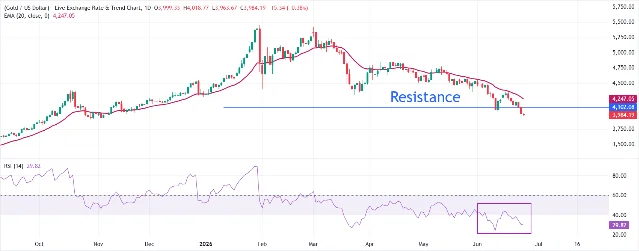
| COMEX Gold | GCQ6 (Aug) | $4,041.60 | +$32.80 | +0.82% | 52-wk range: $3,886–$5,318; −24% from Jan 29 high |
| NYMEX WTI | CLQ6 (Aug) | $71.92 | +$2.06 | +2.95% | Pre-war close (Feb 27): ~$72; bounced off post-war low |
| ICE Brent | BZN6 (Aug) | $75.26 | +$1.52 | +2.10% | WTI-Brent spread: $3.34 (narrowed from $3.99) |
| COMEX Copper | HGN6 (Jul) | $6.0740 | +$0.1255 | +2.11% | 52-wk range: $4.33–$6.72; snaps 5-day −8.41% skid |
| CBOT Corn | ZCN6 (Dec) | 442.75¢ | +8.00¢ | +1.84% | Key reversal after 4-day losing streak; overnight contract low |
| CBOT Soybeans | ZSN6 (Nov) | 1,157.00¢ | +22.00¢ | +1.94% | 5-day: +1.36%; China purchase confirmed in weekly report |
| Macro indicator | Jun 24 | Jun 25 | Δ |
|---|---|---|---|
| DXY | 101.61 | 101.32 | −0.29 (off one-year high) |
| 10Y Treasury yield | 4.392% | 4.39% | −0.2 bp |
| CME FedWatch Sep hike | 70.3% | 64.9% | −5.4 pp |
| CME FedWatch Dec hike | 85.5% | 82.2% | −3.3 pp |
Gold: $4,000 holds on PCE relief — a rate story, not a war story
Crude oil: $71.92 WTI — Iran fires on cargo ship, IMO pauses Hormuz evacuation
Copper: +2.11% to $6.0740 — Grasberg force majeure ends 5-day rout
Grains: Corn key reversal, soybeans on China; June 30 USDA Acreage looms
Corn ZCN6: 8¼¢ gain snaps 4-day skid; contract-low reversal confirmed
Soybeans ZSN6: 22¢ rally as China steps back into the market
Cross-market: DXY retreats, yields dip, equities flat — the "Goldilocks PCE" trade
Fuentes de referencia
- 1Morningstar/Dow Jones: Comex Gold Settles 1.01% Higher at $4,030.50
- 2Reuters: Oil prices climb 2% after cargo ship hit by projectile near Oman
- 3Forbes: Key inflation measure neared 3-year high in May
- 4MarketWatch: GC00 Gold Continuous Contract
- 5Kitco: Gold Price Today live spot
- 6BEA.gov: Personal Income and Outlays, May 2026
- 7CNBC: PCE inflation report May 2026
- 8CNBC: 10-year Treasury yield little changed after May inflation data
- 9Vantage Markets: XAUUSD — Gold's $4,000 break is a rate story, not a war story
- 10Kitco/Reuters: US bond market expects rate hikes the Fed may never deliver
- 11Seeking Alpha: Markets price in Fed hikes, but El-Erian believes no hikes more likely
- 12FXStreet: Gold Price Forecast — XAU/USD holds below $4,000 ahead of US PCE
- 13CruxInvestor: Brent falls to $72.46 as Hormuz flows reach 32%
- 14Reuters: UN agency pauses Hormuz ship evacuation after vessel attacked
- 15IMO: Statement on the attack and Hormuz evacuation pause
- 16Politico: Hormuz evacuation effort on hold after new ship attack
- 17BBC: UN pauses Hormuz evacuation after cargo ship attacked
- 18The Guardian: Iran rejects UN-backed plan to free ships trapped in Hormuz
- 19Reuters: Rubio wraps up Gulf tour as allies share concerns over Iran accord
- 20Reuters: Iraq warns it might leave OPEC if quota not raised
- 21FDD: Overnight Brief — June 25, 2026
- 22CNBC: Chevron CFO says gas prices will normalize after Trump presses Big Oil
- 23VermontBiz/GasBuddy: National average gas on track for second most expensive July 4 ever
- 24The Moscow Times: As fuel crisis widens, Russia's regions brace for the worst
- 25MarketWatch: HG00 Copper Continuous Contract
- 26Investing.com: Gold falls toward $4,000/oz (includes copper/Grasberg context)
- 27MarketWatch: C00 Corn Continuous Contract
- 28DTN Progressive Farmer: Periodic updates on the grains/livestock futures markets
- 29Brownfield Ag News: Unknown, China boost new-crop U.S. soybean sales
- 30Feed & Grain: Corn, soybean exports fall in weekly report
- 31DTN Progressive Farmer: Excessive heat forecast for next week
- 32Pro Farmer: First Thing Today — 'Turnaround Tuesday' modest overnight rallies in grains
- 33Successful Farming: USDA Acreage Report looms as survey signals more corn, fewer soybeans
- 34Successful Farming / Agriculture.com: Soybeans close up 22¢ — Thursday, June 25, 2026
- 35RadarCrop: 372,000 MT soybean flash sale to unknown destinations
- 36AgWeb: Storm-battered Midwest crops need a triage plan
- 37AgWeb: Grains end lower as funds sell early gains
- 38Barron's live coverage: Treasury yields rise, dollar falls ahead of PCE
Contenido relacionado
Seleccionado de otros canales según similitud de contenido. Descubre nuevos creadores a seguir.
 Artículo
XAUUSD Weekly Intel #7: The $53 Drop and the Rebound — Gold at $4,520, Iran Talks on Knife's Edge, NFP Friday Holds the Key
Gold shed $53 on June 1 as the S&P hit record highs on Iran deal optimism, then bounced back toward $4,520 as Tehran suspended US talks. ISM Manufacturing PMI hit 54.0 (highest since May 2022), locking in the 'higher for longer' case. This mid-week update maps the revised channel levels, the ISM impact on Fed expectations, and the JOLTS-ADP-NFP sequence that will decide whether gold breaks to $4,620 or retests the 200-day MA at $4,366.
XAUUSD Weekly Gold Trading Intelligence
 Artículo
XAUUSD Weekly Intel #15: $4,023 Six-Month Low, $212 Intraday Reversal — FOMC Monday Is the Only Number That Matters Now
Gold hit a 6-month low of $4,023 on Thursday after PPI printed +6.5% YoY (hottest since 2022), then surged $212 in a single session as Trump announced an Iran peace deal — only to pull back below $4,200 Friday when Tehran contradicted the claim. Spot trades ~$4,196, down 6.3% on the week. This issue maps the confirmed technical breakdown below $4,097, the contested Iran deal optionality, four FOMC week scenarios with probabilities, and concrete short/long setups with invalidation levels ahead of Warsh's first Fed meeting Monday–Tuesday.
XAUUSD Weekly Gold Trading Intelligence Artículo
XAUUSD Weekly Intel #11: Monday Holds $4,341 — CPI Tomorrow Is the Only Number That Matters
Gold stabilized at $4,340.98 on Monday after Friday's $147 NFP crash — flat on the session as US-Iran military strikes and a 4% crude oil surge kept geopolitical risk alive while yields pulled back slightly to 4.49%. The real test is Wednesday's May CPI: consensus calls for +0.6% headline / +0.4% core, which would lock in the rate-hike narrative and target $4,250–$4,200. A soft core surprise is the only credible bounce scenario. Full scenario matrix, updated channel levels, short setup at $4,360–$4,376, conditional long below $4,265, and the week's macro calendar including ECB Thursday and FOMC June 16–17.
XAUUSD Weekly Gold Trading Intelligence Artículo
XAUUSD Weekly Intel #12: CPI in 90 Minutes — Gold Already Down $98, $4,172 Floor Is the Last Line Before $4,000
Gold is trading at $4,188–$4,192 Wednesday morning, down $98 from Monday's settlement, as May CPI prints at 8:30 AM ET. This pre-release brief maps four CPI scenarios with exact price targets, the current technical structure after the 200-day MA breakdown ($4,172 now the last support before $4,097 and the $3,900–$4,000 pattern target), why Iran escalation is paradoxically pushing gold lower via the rate-hike channel, and concrete short/long setups with pre-defined invalidation levels.
XAUUSD Weekly Gold Trading Intelligence Artículo
XAUUSD Weekly Intel #13: CPI Printed 4.2% — Core Gave a Reprieve, Oil Still Holds the Match, Gold at $4,157
May CPI came in at +4.2% YoY (hottest since April 2023) with a soft core at +0.2% MoM — the market got a temporary reprieve from the rate-hike scare, but gold kept falling. Spot is now near $4,157, down 11% in a month, with the 200-day MA a $290 overhead wall. This issue maps the post-CPI technical structure ($4,097–$4,100 is the last major support before $3,900–$4,000), why Iran paradoxically keeps pushing gold lower, the PPI/ECB/FOMC calendar for the rest of the week, probability-weighted scenarios, and concrete short/long setups with defined invalidation levels.
XAUUSD Weekly Gold Trading Intelligence Artículo
XAUUSD Weekly Intel #3: The $150 Reversal — Can Bulls Defend $4,481 Into NFP?
Gold just staged a $150 intraday reversal off the 200-day MA ($4,366 low → $4,516 close) on May 28, driven by weak GDP (+1.6%), softer Core PCE (+0.2% MoM), and US-Iran ceasefire progress. The week of June 2–6 is now a validation test: can bulls hold $4,481.78 into a data-heavy sequence ending with NFP on Friday? Complete channel map, updated macro dashboard with all Thursday data points, 5-day daily outlook, and long/short setups with invalidation levels.
XAUUSD Weekly Gold Trading Intelligence
Añade más opiniones o contexto en torno a este contenido.