XAUUSD Weekly Intel #15: $4,023 Six-Month Low, $212 Intraday Reversal — FOMC Monday Is the Only Number That Matters Now

XAUUSD Weekly Intel #15: $4,023 Six-Month Low, $212 Intraday Reversal — FOMC Monday Is the Only Number That Matters Now

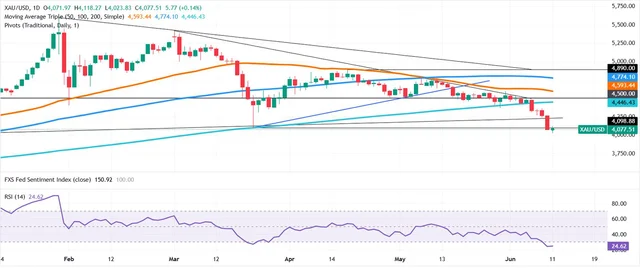
Gold hit a 6-month low of $4,023 on Thursday after PPI printed +6.5% YoY (hottest since 2022), then surged $212 in a single session as Trump announced an Iran peace deal — only to pull back below $4,200 Friday when Tehran contradicted the claim. Spot trades ~$4,196, down 6.3% on the week. This issue maps the confirmed technical breakdown below $4,097, the contested Iran deal optionality, four FOMC week scenarios with probabilities, and concrete short/long setups with invalidation levels ahead of Warsh's first Fed meeting Monday–Tuesday.

XAUUSD Weekly Gold Trading Intelligence
12/6/2026 · 10:15
2 suscripciones · 15 contenidos

XAUUSD Weekly Intel #15: $4,023 low, $212 intraday swing, and everything now pivots on FOMC Monday

Friday, June 12 | Pre-close update
Gold closed out the week in whiplash mode. The metal printed a 6-month low of $4,023 on Thursday morning before rallying $212 in a single session — the biggest intraday reversal since March — only to pull back below $4,200 again in Asian trading Friday as Iran's government contradicted Trump's claim that a peace deal had been signed. Spot is currently trading near $4,196, down roughly 6.3% on the week and on pace for the worst weekly loss since mid-March.1
The week leaves three distinct structural shifts that traders need to absorb before Monday's FOMC opens.
Cargando tarjeta de estadísticas…

What actually happened this week

Monday through Wednesday followed the bearish script established after the $4,097 break last week. CPI on Wednesday printed +4.2% YoY headline / +0.2% MoM core — the hottest headline in three years, but the soft core gave markets a brief pause before sellers resumed.2
Thursday was the week's defining session. In sequence:
  1. PPI arrived at +1.1% MoM / +6.5% YoY — the largest annual increase since November 2022, above the +6.4% forecast. Core PPI +4.9% YoY, slightly below the +5.4% estimate.3
  2. Jobless claims came in at 229K (vs. 219K expected), continuing a slow drift higher.
  3. Gold briefly breached $4,097 to the downside overnight, hitting $4,023 — the lowest close since late November 2025.
  4. Then Trump posted on Truth Social that he would strike Iran "VERY HARD TONIGHT" and was considering seizing Kharg Island (handles ~90% of Iran's oil exports).4
  5. Hours later, Trump reversed: said a "great settlement" had been reached, that Iranian Supreme Leader Mojtaba Khamenei had signed off, and a deal could be signed "this weekend."
  6. DXY dropped from 100.28 to 99.66, oil fell 3%+, and gold surged from $4,023 to $4,212 (+3.5%) within hours.5
Friday morning, Iran's FARS news agency issued a more cautious statement: "Given that the United States has accepted the text proposed by Iran, the likelihood of approval is high" — but crucially, Tehran has not confirmed final sign-off, and disputes over the Strait of Hormuz status and frozen funds remain unresolved. Gold dropped back below $4,200 and the DXY began recovering. The whipsaw is not over.
XAUUSD daily chart showing the $4,023 six-month low and $212 intraday reversal on June 11
XAU/USD daily chart, showing key support structure below $4,100; 200-day SMA at $4,443 is now a distant overhead wall. 2

The three structural forces going into FOMC week

1. The rate-hike channel is now the dominant driver

The Iran paradox is fully established: hot inflation from energy costs → expectations for Fed rate hikes → stronger dollar + higher real yields → gold falls. This channel now dominates the geopolitical safe-haven reflex. The numbers back it up.
Data pointActualPrior / EstimateDirection for gold
CPI May YoY headline+4.2%+3.8% (Apr) / +4.0% estBearish
CPI May MoM core+0.2%+0.4% (Apr) / +0.3% estMildly bullish reprieve
PPI May YoY headline+6.5%+5.7% (Apr) / +6.4% estBearish
PPI May core YoY+4.9%+4.9% (Apr) / +5.4% estSlight relief
Initial jobless claims229K219K est / 225K priorMildly bearish for cuts
CME FedWatch: Dec hike odds67%~20% two months agoBearish
10-yr Treasury yield~4.47%4.55% (Thurs peak)Bearish pressure
DXY~99.66100.28 (Thursday)Headwind
Kevin Warsh chairs his first FOMC meeting Monday–Tuesday June 16-17. The market assigns ~99% probability to a hold at 3.50–3.75%, but traders are watching his press conference language closely for any signal on the December path. A hawkish statement or dots shift would likely test the $4,059 floor immediately; any dovish language (unlikely given the data) would be the first genuine bounce catalyst.

2. The Iran deal: optionality, not resolution

Trump's "deal signed by Khamenei" statement drove the $212 intraday move — but the move already half-retraced by Friday morning. There are two reasons to stay cautious:
  • Iran's official position: text is likely to be approved, but the Strait and frozen funds are still being negotiated. No signed document has been released publicly.
  • JPMorgan's analysis showed roughly $20 billion in gold ETF outflows in the week to June 5, with futures positioning unwinding systematically since end-February.1 A confirmed deal that reopens Hormuz would remove the energy-inflation channel entirely — that would be structurally bullish for gold if rate-hike expectations then collapsed, but the timing is uncertain.
Market structure: Citi notes gold broke its 200-day SMA for the first time since September 2023, calling it a "major negative signal" short-term. Long-term Citi remains constructive on structural demand.

3. Technicals: the $4,059–$4,097 range is the deciding zone

The six-month low at $4,023 set a tradeable floor, but it has not been tested on a daily close. Key levels going into next week:
LevelSignificance
$4,059Immediate support / LiteFinance key support 6
$4,023–$4,027Thursday's 6-month intraday low; also the week's critical floor
$4,006Next support below $4,059
$3,886October 28, 2025 swing low — the major structural floor if $4,000 fails
$4,097–$4,100Resistance (was prior support, now flipped)
$4,157Next resistance
$4,200–$4,212Thursday's intraday high / near-term ceiling
$4,443200-day SMA — overhead wall
RSI is in oversold territory but not at the most extreme level. MACD is in negative territory, still signaling bearish momentum with gradually weakening slope.6 The daily downtrend from the March ATH of $5,477 remains fully intact — 11 consecutive lower highs since that print.

News impact table — events that move gold this week and next

EventDateActual / StatusExpected gold impact
CPI MayJun 11+4.2% YoY / +0.2% MoM coreBearish on headline; core gave brief reprieve
PPI MayJun 11+6.5% YoY (hottest since Nov 2022)Bearish — confirms inflation broadening
ECB rate decisionJun 11Hiked +25bp to 2.25% (first hike since Sep 2023)Mild bearish (global tightening trend)
Jobless claimsJun 11229K (vs. 219K est)Neutral/slightly bearish for rate cuts
Trump Iran strike threat → peace dealJun 11Threatened Kharg seizure, then reversed on "settlement"$212 intraday swing; still unresolved
University of Michigan sentiment (prelim)Jun 12Due todayDownside surprise → mild bullish; upside → bearish
FOMC decision + Warsh press conferenceJun 16-17Hold expected (99% probability)Critical: statement language + dot plot
BoJ meetingJun 16-17Rate decision dueJPY/USD cross effect on gold positioning

5-day outlook: June 13–17 probability scenarios

The week ahead is almost entirely defined by two events: any Iran deal signing over the weekend (if it happens before Monday open) and FOMC Wednesday + Warsh presser.
Scenario A — Bear continuation (45% probability) FOMC hold + Warsh language stays hawkish; Iran deal language remains contested. Gold fails to hold $4,100 on any bounce, slips back to test $4,059 → $4,023. Below $4,000 opens $3,886. This is the base case given the ongoing rate-hike channel.
Scenario B — Consolidation range (30% probability) FOMC hold + Warsh is neutral, no strong signals either way. Iran deal talks remain ambiguous. Gold ranges $4,060–$4,200 through the week. Choppy, no directional trade.
Scenario C — Bounce rally (15% probability) Iran deal formally signed over weekend → Hormuz reopening timeline becomes clear → WTI drops to $75–80 → inflation expectations ease → rate hike odds drop from 67% → gold bounces toward $4,250–$4,350. Requires a credible, signed, publicly confirmed deal — not just a verbal claim.
Scenario D — Deeper breakdown (10% probability) Iran deal collapses or Warsh signals December hike in dot plot. Gold cracks $4,000 on a daily close. Institutional stop-loss cascade to $3,886.
Cargando gráfico…

Trade setups

Short setup (primary bias)

Thesis: Bear trend intact, every bounce remains a distribution zone. Rate-hike channel dominates. Iran "deal" reprieve already partially faded.
  • Entry zone: $4,157–$4,200 on any bounce, confirmed with rejection candle or lower volume fade
  • Trigger: Price fails to close above $4,157 on the 4H; DXY stabilizes or recovers above 100.00
  • Targets: $4,097 → $4,059 → $4,023 → $4,006
  • Invalidation: Daily close above $4,213 (Thursday's intraday high), particularly if confirmed by a 4H close above $4,200 with volume
Patience rule: Do not chase entries inside $4,100–$4,157 mid-range. Wait for price to return to $4,157–$4,200 resistance or break below $4,059 with confirmation.

Conditional long setup (counter-trend only)

Thesis: Oversold RSI + potential Iran deal catalyst creates a bounce setup — not a trend reversal.
  • Entry zone: $4,027–$4,059, confirmed with 4H bullish reversal candle or volume spike
  • Trigger: Credible Iran deal confirmation OR Warsh press conference language notably more dovish than expected
  • Targets: $4,097 → $4,157 → $4,200 (take partials; this is a counter-trend trade)
  • Invalidation: Daily close below $4,023; no-deal confirmation by Sunday; Warsh signals December hike

No-trade conditions

  • During FOMC statement release and first 30 minutes of Warsh press conference
  • If spot is between $4,097 and $4,157 with no clear directional catalyst — this is the mid-range chop zone
  • Any fresh Iran Kharg Island military action prior to a signed deal

Risk warnings

Main risk: The rate-hike narrative doesn't need Iran to go wrong. If FOMC dots shift toward a December hike, gold likely tests $3,886 without needing further geopolitical escalation.
Fake-move risk: Thursday's $212 intraday reversal is the textbook example. Trump's Truth Social post drove $100+ of that move. A single social media post is not a trading catalyst — only publicly confirmed deals with signed documentation qualify as structural. Any "peace deal" rally before a formal signing should be treated as a short-term hedge, not a trend reversal.
News risk: A confirmed Iran Strait of Hormuz reopening would be the single largest structural reversal catalyst possible. If that materializes over the weekend, the Monday open could gap. Traders with short positions going into the weekend should be sized appropriately.
Data gap: Friday's University of Michigan preliminary sentiment print (June 12, 10AM ET) has not yet been released at time of writing. A significant drop in inflation expectations within that survey would be the first clean soft signal in several weeks — watch it.
Standard disclaimer: All levels and scenarios in this report are grounded in publicly available market data as of June 12, 2026. Price channels and probabilities are analysis, not guarantees. Every trade presented includes a defined invalidation level — use it. Nothing here constitutes investment advice.

Añade más opiniones o contexto en torno a este contenido.

  • Inicia sesión para comentar.