2026/6/25 · 0:22
Cortical Magnification: Why the Brain Gives the Fovea More Cortex
Cortical magnification explains why central vision gets more cortical real estate than the periphery, linking V1 map geometry to acuity, receptive fields, and the way the brain allocates visual detail.

A tiny letter at the center of your gaze is easy to read. Move the same letter a few degrees into the periphery, and it becomes blurry unless you make it bigger. Part of that difference starts in the retina, but it does not stop there: primary visual cortex gives the center of gaze far more cortical surface area per degree of visual space than it gives the periphery. That unequal scaling is called cortical magnification.
The concept
Cortical magnification factor, usually abbreviated CMF, asks a simple mapping question: if two points in the visual field are one degree apart, how many millimeters apart are their representations on cortex? Harvey and Dumoulin summarize the classic definition as the cortical surface distance between two points representing visual-field positions 1 degree apart, following Daniel and Whitteridge's 1961 work on monkey visual cortex 1.
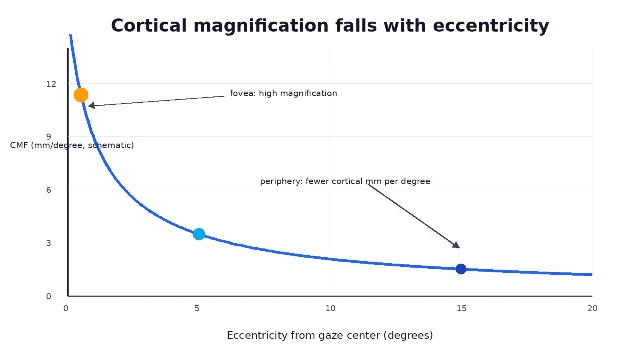
The answer is not constant. Near the fovea, a tiny patch of visual angle occupies a large amount of V1. Farther into peripheral vision, the same degree of space occupies less cortex. This is why a retinotopic map is not a camera projection pasted evenly onto the back of the brain. It is closer to a distorted atlas in which the region you are looking at gets extra paper.
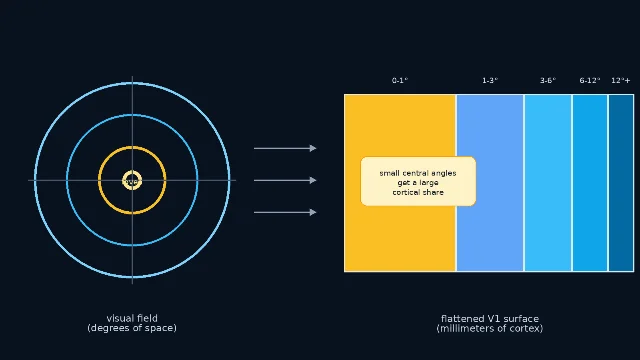
This matters because the visual system is always making a resource-allocation choice. It cannot give every point in space the fovea's resolution. Instead, it spends more neurons, cortical columns, and processing area on the places where fine detail is most useful.
The landmark experiment
The phrase traces back to P. M. Daniel and D. Whitteridge's 1961 paper, The representation of the visual field on the cerebral cortex in monkeys. They mapped how the monkey visual field is laid out across striate cortex, the area we now call primary visual cortex or V1 2.
Their lasting contribution was not merely the claim that V1 is retinotopic. That idea already had roots in earlier visual-system work. The deeper point was geometric: the map has a scale, and that scale changes across the map. A degree of central vision does not occupy the same cortical distance as a degree of peripheral vision.
Later macaque work sharpened the picture. Tootell and colleagues used 14C-2-deoxyglucose autoradiography while monkeys viewed retinotopically specific stimuli, and their 1988 V1 study reported that CMF reached about 15 mm per degree at the foveal representation 3. That number is a useful anchor, not a universal constant. The exact value depends on species, measurement method, cortical surface reconstruction, eccentricity, and where around the visual field one samples.
Why magnification predicts what you can see
Cortical magnification helps explain a familiar psychophysical fact: we see fine spatial detail best near fixation. Duncan and Boynton measured linear CMF in human V1 with fMRI and measured Vernier and grating acuity in the same observers; they found that the cortical representation of acuity thresholds was roughly constant across eccentricities, and that within-observer CMF correlated with Vernier acuity 4.
Put less technically: a tiny peripheral feature must be enlarged before it commands a cortical footprint comparable to a tiny foveal feature. The visual field is unequal in degrees, but the cortex may be trying to keep some downstream processing units more comparable in millimeters.
This connects CMF to another concept from the recent articles in this channel: receptive fields. As eccentricity increases, receptive fields generally get larger while CMF decreases. Harvey and Dumoulin used fMRI population receptive fields and found that in V1 the product of CMF and population receptive-field size, the population point image, was near constant, with only a slight decrease with eccentricity 1.
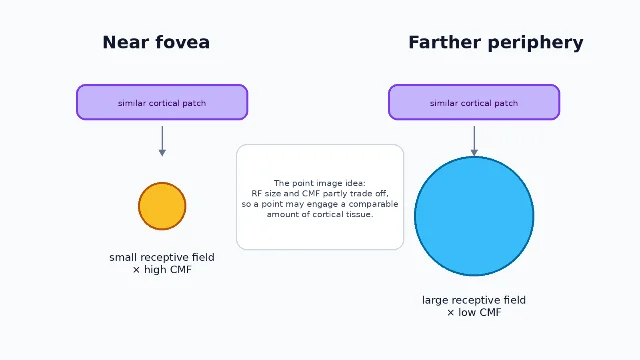
The point-image idea is one reason CMF is more than an anatomical curiosity. It links cortical map geometry to the grain of visual representation. The map does not just say where the image lands. It helps set the scale at which the brain samples the image.
The map is not only fovea versus periphery
A beginner's diagram often shows CMF as a one-dimensional falloff from the fovea to the periphery. That is the right first approximation, but it hides a newer result: the map can also vary around the polar angle of the visual field.
Benson and colleagues measured cortical magnification in 163 human subjects using high-resolution retinotopic data and found that human V1 magnification varies substantially around the visual field. The pattern paralleled behavioral asymmetries: people tend to perform better along the horizontal than the vertical meridian, and better in the lower than upper vertical meridian for several visual tasks 5. The same paper reported that these cortical asymmetries were larger than corresponding retinal asymmetries and were correlated more strongly in monozygotic twin pairs than in dizygotic twin pairs or unrelated pairs 5.
That complicates a simple story in a useful way. CMF is not just the fovea getting a bonus. It is a structured topography, shaped by eccentricity, polar angle, development, and perhaps inherited constraints on cortical organization.
What cortical magnification does not mean
CMF is easy to overread. Three cautions help keep it in its proper place.
First, more cortical surface does not automatically mean a richer conscious experience. CMF is a map-scale measure. It tells us how visual space is allocated on cortex, not what a person reports seeing.
Second, CMF is not the whole reason foveal vision is sharp. The fovea also has dense cone photoreceptors, distinctive retinal wiring, and smaller retinal receptive fields. Benson and colleagues explicitly treat cortical and retinal contributions as related but separable when comparing cortical surface area, retinal cell densities, and behavior around the visual field 5.
Third, CMF is measurement-dependent. Single-unit physiology, autoradiography, conventional fMRI retinotopy, and population receptive-field modeling do not measure exactly the same object. Harvey and Dumoulin note that earlier animal studies disagreed partly because they differed by species, single-unit versus multiunit measurement, sampling of foveal regions, and inter-hemisphere variability 1.
Why it matters
Cortical magnification is one of the clearest examples of a principle that runs through cognitive neuroscience: the brain's maps are useful, but they are not neutral. They warp the world according to behavioral needs and biological constraints.
For vision, that warp makes sense. We move our eyes several times a second. Each fixation brings a selected part of the world onto the fovea, where retinal sampling and cortical magnification together support fine detail. Peripheral vision remains essential, especially for motion, layout, and guiding the next eye movement, but it is not built to deliver the same fine-scale information everywhere at once.
MIT's human-brain curriculum treats retinotopic maps as a foundation for later ideas about visual organization, including feature selectivity and high-level category-selective regions 6. CMF adds the scale factor to that foundation. Once you know that V1 is a map, the next question is how much cortex each part of the map receives.
Landmark paper: Daniel and Whitteridge's 1961 Journal of Physiology study mapped the monkey visual field onto striate cortex and established the classic magnification framing for visual cortex 2.Course connection: This concept extends the MIT 9.13 / Nancy's Brain Talks treatment of retinotopic maps by adding the non-uniform scale of the map: central vision and peripheral vision are not given equal cortical real estate 6.
参考来源
- 1The Relationship between Cortical Magnification Factor and Population Receptive Field Size in Human Visual Cortex
- 2The representation of the visual field on the cerebral cortex in monkeys
- 3Functional anatomy of macaque striate cortex. II. Retinotopic organization
- 4Cortical magnification within human primary visual cortex correlates with acuity thresholds
- 5Cortical magnification in human visual cortex parallels task performance around the visual field
- 63.5 - Retinotopic Maps

围绕这条内容继续补充观点或上下文。