2026/7/2 · 15:36
The average S&P 500 stock is winning
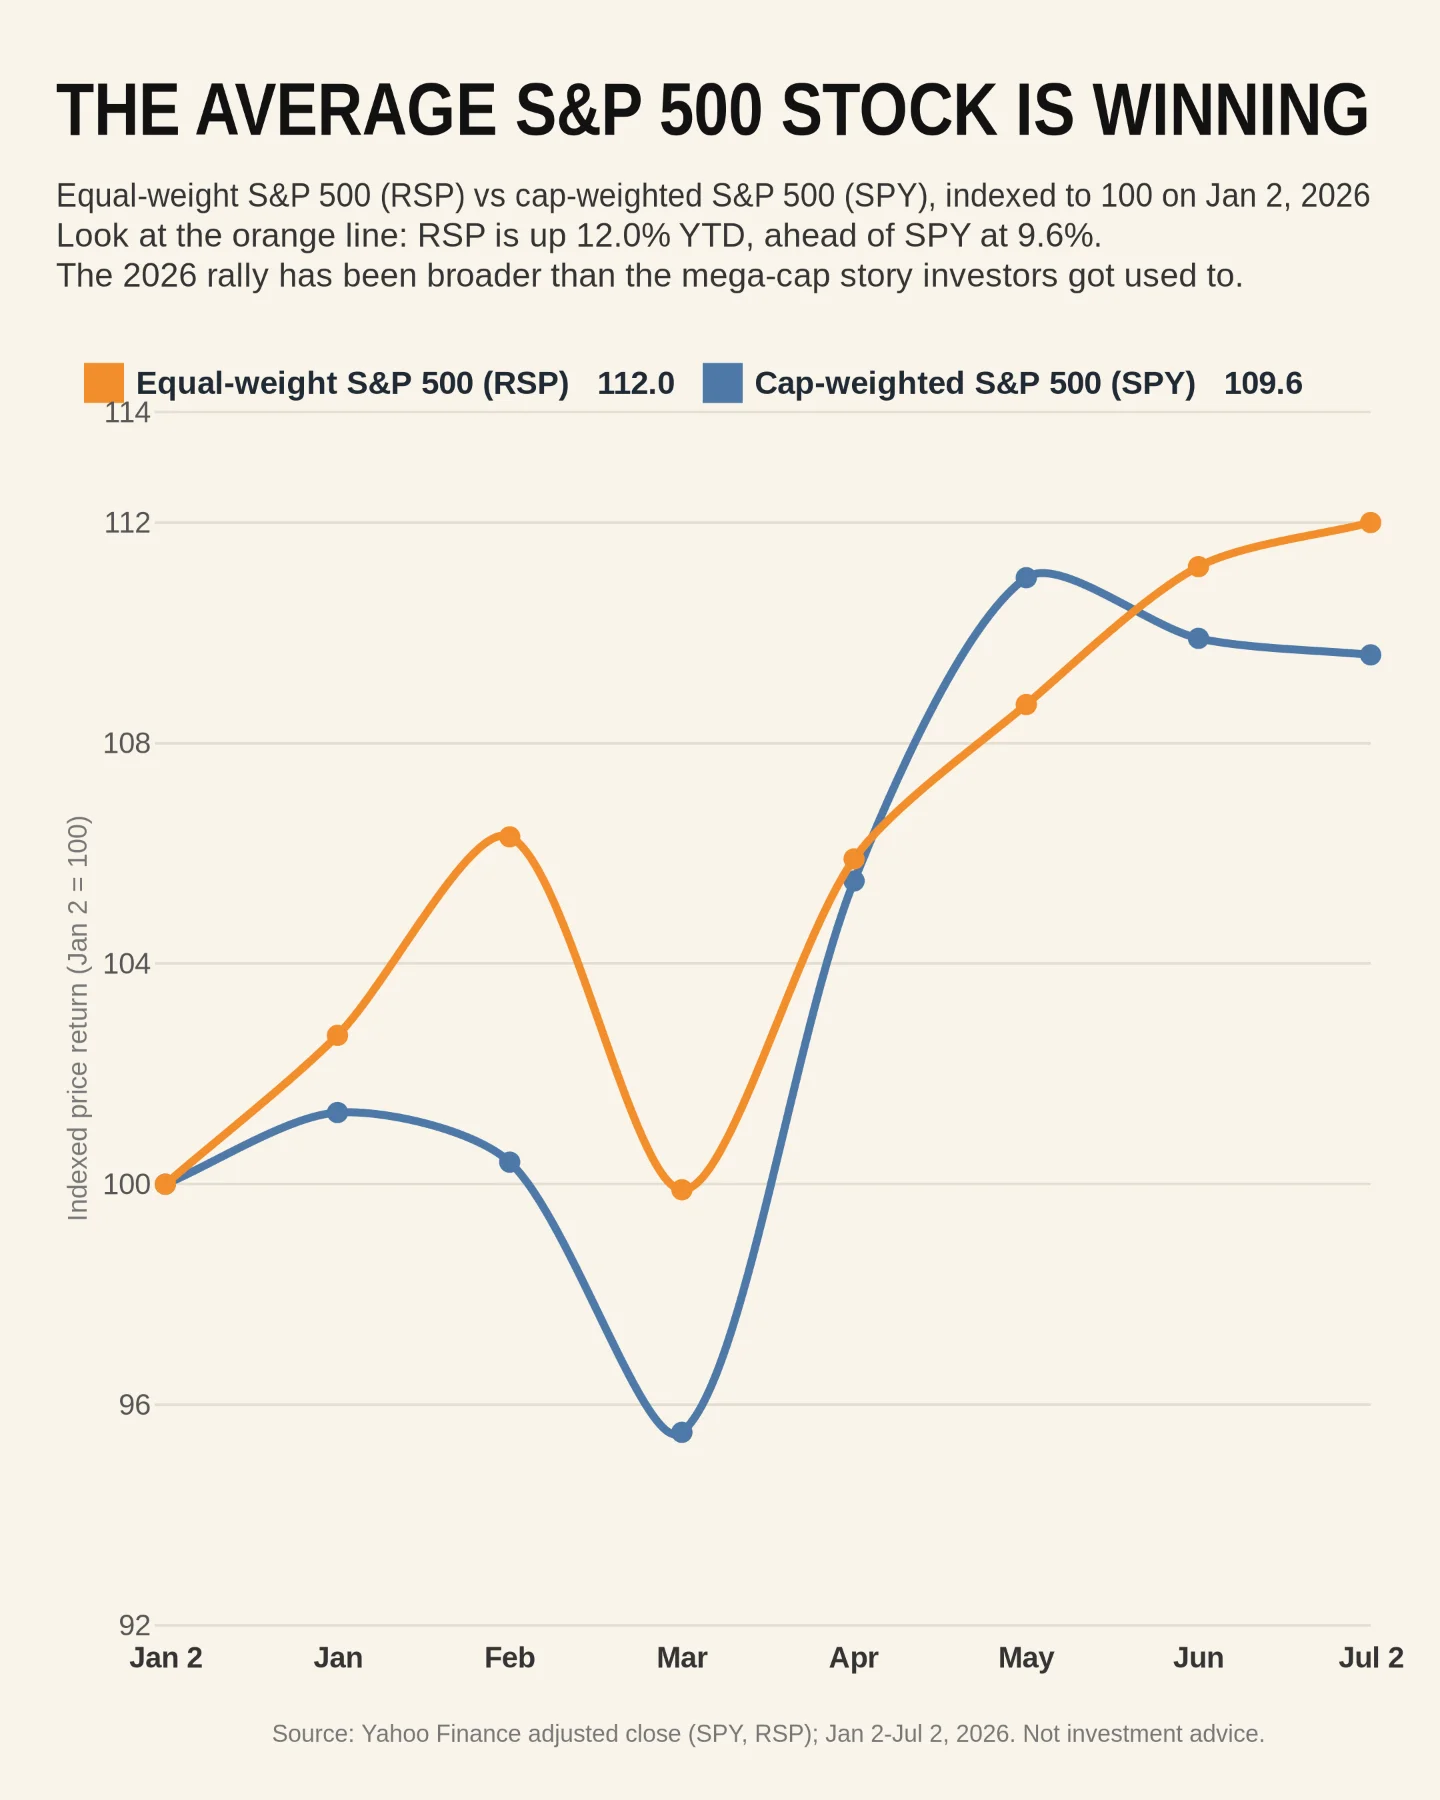
A one-card chart showing that equal-weight S&P 500 exposure has outpaced the cap-weighted index in 2026, pointing to a broader rally than the recent mega-cap-led market.

Today’s chart compares the equal-weight S&P 500 ETF (RSP) with the cap-weighted S&P 500 ETF (SPY), both indexed to 100 at the first trading day of 2026.
RSP finished at 112.0 on July 2, 2026, versus 109.6 for SPY. In plain English: the average stock in the index has been leading the index itself this year, a broader setup than the mega-cap-led market investors got used to. 1 2
Data source on card: Yahoo Finance adjusted close for SPY and RSP, Jan 2-Jul 2, 2026. This chart describes market behavior; it is not investment advice.
评论
登录后可发表评论。