2026/6/18 · 8:26
Stablecoin daily (Jun 18): Post-FOMC burn triples to $760M as Warsh's dot plot erases 2026 cut
Big-3 stablecoins burned −$760.4M on Day 23 — 3.1× Day 22's pre-FOMC drain — as Warsh's first FOMC meeting held rates at 3.50–3.75% but flipped the dot plot: 9 of 18 members now project a hike in 2026, median 2026 rate revised to 3.8%, easing bias stripped from the statement. Ethereum USDT shed −$343.2M (its largest single-day drain in the recent tracking period), Tron USDT ended its 3-day flat streak at −$162.0M, and combined BTC+ETH ETF outflows hit −$111.5M on FOMC decision day. Fear & Greed dropped to 15 (Extreme Fear), the series low; the sole counter-trend signals were Aptos (+$85.8M combined) and USDe's continued growth to $4.506B.

Coverage window: Jun 17, 13:31 UTC → Jun 18, 13:00 UTC (~23.5h · Day 23 · Post-FOMC Day 1)
The dot plot did the damage. Kevin Warsh (Federal Reserve Chair, first meeting after replacing Jerome Powell in May 2026) held rates at 3.50–3.75% in a 12-0 vote — the outcome markets had priced at 97%. What they hadn't fully priced: a dot plot where 9 of 18 FOMC members now project at least one rate hike by end 2026, with the median year-end rate rising to 3.8% from March's 3.4%. The prior easing bias was stripped from a statement cut from 341 words to 130. 1 The on-chain reaction was immediate: Big-3 stablecoins burned −$760.4M on Day 23, accelerating 3.1× from Day 22's pre-FOMC −$249.6M. Fear & Greed fell to 15 — the lowest reading in this 23-day series. 2
Quick scan
| Asset / signal | 24h direction | Value | 24h change |
|---|---|---|---|
| USDT total | Net burn | $185.971B | −$441.9M (−0.24%) |
| USDC total | Net burn | $74.511B | −$381.2M (−0.51%) |
| DAI total | Micro-burn | $4.396B | −$16.6M (−0.38%) |
| Big-3 combined | 2nd consecutive burn | $264.957B | −$760.4M (−0.29%) |
| Ethereum USDT | Largest recent drain | $79.933B | −$343.2M (−0.43%) |
| Ethereum USDC | Drain accelerates 5.7× | $48.137B | −$117.1M (−0.24%) |
| Tron USDT | 3-day pause ends | $87.536B | −$162.0M (−0.18%) |
| Solana USDC | 5th consecutive drain | $7.253B | −$66.1M (−0.90%) |
| Arbitrum USDC | Drain near zero | $2.303B | −$8.6M (−0.37%) |
| Hyperliquid L1 USDC | Narrows vs. Solana | $6.132B | −$91.2M (−1.47%) |
| Aptos USDT | Counter-trend inflow | $1.056B | +$49.9M (+5.0%) |
| Aptos USDC | Counter-trend inflow | $177.8M | +$35.9M (+25.3%) |
| USDe (Ethena) | Only Big-5 grower | $4.506B | +$15.9M (+0.35%) |
| USDS (Sky) | Continued contraction | $8.171B | −$16.8M (−0.21%) |
| BTC | Post-FOMC dip | $64,324 | −1.27% 24h / +2.24% 7d |
| ETH | Outperforms on 7d | $1,748 | −0.66% 24h / +5.94% 7d |
| BTC ETF (Jun 17) | FOMC risk-off reversal | −$82.2M | ARKB −$43.5M, IBIT −$30.8M |
| ETH ETF (Jun 17) | Broad-based selling | −$29.3M | 7 of 10 funds negative |
| Fear & Greed | Series low | 15 (Extreme Fear) | −7 from Day 22 |
Supply snapshot
正在加载统计卡片…
USDT at $185.971B shed −$441.9M (−0.24%) on Day 23. 2 The move was driven jointly by Ethereum USDT (−$343.2M, its largest single-day drain in the recent tracking period) and Tron USDT (−$162.0M, ending three consecutive near-flat sessions). Aptos USDT partially absorbed the exit at +$49.9M, but the net is unambiguously negative. The 7-day USDT trend stands at −$759M; the 30-day at −$3.68B.
USDC at $74.511B shed −$381.2M (−0.51%) — the Big-3's largest single-asset percentage drain on Day 23. 2 Ethereum USDC accelerated its drain 5.7× to −$117.1M, confirming that Day 21's +$621M was an isolated institutional transaction rather than a structural migration. Solana USDC extended to its 5th consecutive daily drain (−$66.1M, decelerating). The 7-day USDC trend is −$376M; the 30-day −$2.42B.
DAI at $4.396B fell −$16.6M (−0.38%), reversing the trivial +$1.8M of Day 22. 2 Magnitude is small but the direction is now aligned with the broader risk-off signal — all three Big-3 assets moved negative simultaneously.
Chain flows: Ethereum and Tron both exit post-FOMC
The Day 22 article framed Tron's consecutive flat days as a pause. Day 23 resolves it: the pause is over. 2
| Chain / asset | 24h change | Context |
|---|---|---|
| Ethereum USDT | −$343.2M (−0.43%) | Largest single-day Ethereum USDT drain in recent period; reverses Day 22's +$157.4M |
| Ethereum USDC | −$117.1M (−0.24%) | 5.7× acceleration from Day 22's −$20.7M; 7d net −$349.6M |
| Tron USDT | −$162.0M (−0.18%) | 3-day flat streak ends; 7d −$644.5M, 30d −$820.5M |
| Solana USDC | −$66.1M (−0.90%) | Day 23 decelerates from Day 22's −$161.1M; 5-day cumulative ~−$521.6M |
| Arbitrum USDC | −$8.6M (−0.37%) | 57.7% deceleration from Day 22's −$20.3M; 30d net still +$113.1M |
| Hyperliquid L1 USDC | −$91.2M (−1.47%) | Fell to $6.132B; gap vs. Solana USDC widens to $1.12B |
| Aptos USDT | +$49.9M (+5.0%) | 7d +$109.8M; combined Aptos USDT+USDC footprint ~$1.23B |
| Aptos USDC | +$35.9M (+25.3%) | Solo counter-trend inflow among major USDC chains |
| Algorand USDC | −$39.0M (−47.5%) | Day 22's anomalous $82.1M jump fully reversed; confirmed transient |
The Ethereum picture on Day 23 is the cleanest post-FOMC signal in the data. Ethereum USDT and Ethereum USDC both fell simultaneously — −$343M and −$117M respectively — for a combined Ethereum stablecoin exit of roughly −$460M in a single session. Ethereum USDT still holds 43.0% of total USDT supply ($79.9B); Tron USDT holds 47.1% ($87.5B). At the USDT level, both major chains are now in outflow, which eliminates the single-chain-drag explanation: this is broad-based de-risking, not chain rotation.
正在加载图表…
Arbitrum USDC deserves a separate note. After −$131.6M on Day 21 and −$20.3M on Day 22, the drain slowed to −$8.6M on Day 23 — three consecutive sessions of deceleration. The 30-day net for Arbitrum USDC is still +$113.1M, meaning the chain absorbed capital earlier in the cycle and is now giving back a fraction of it. At current rates, Arbitrum outflows could approach zero by Day 24–25. 2
Solana USDC at $7.253B logged a 5th consecutive negative session at −$66.1M — decelerating from Day 22's −$161.1M but still directionally consistent. The 5-day cumulative drain is approximately −$521.6M. Hyperliquid L1 USDC fell −$91.2M to $6.132B, keeping the gap between the two platforms at $1.12B. The convergence thesis from earlier in the series has stalled: both are now in outflow, Hyperliquid slightly faster (-1.47% vs. -0.90%). 2
FOMC: Warsh's first meeting pencils in a 2026 hike
The Summary of Economic Projections (dot plot) — submitted by 18 of 19 FOMC members, with Warsh abstaining — shifted materially:
- Median year-end 2026 rate: 3.8% (up from 3.4% in March), implying at least one 25bp hike
- 9 of 18 submitting officials project a hike in 2026; 6 of those 9 see more than one
- The prior March dot plot had projected a rate cut in 2026 — that cut has been erased entirely
- Headline PCE inflation forecast lifted to 3.6% (from 2.7%); Core PCE to 3.3% (from 2.7%)
- GDP growth revised down to 2.2% (from 2.4%)
The statement itself was stripped from 341 words (April) to 130, removing the easing bias entirely. The new version reads: "The Committee will deliver price stability."
Warsh declined to submit his own dot: "I did not submit a dot for me. It's not helpful in the conduct of policy." 1 He separately launched five internal task forces reviewing Fed communications (including whether to eliminate the dot plot entirely), balance sheet policy, data reliance, productivity/jobs, and the broader policy framework — with a new communications structure possible by year-end.
On the dots his colleagues submitted: "I noted that all the submissions were coming in with pencils, you know, those kind with the big erasers. That's to say that I think my colleagues around the table when they submitted their dots understand the world is changing quite quickly and they didn't feel bound by them six weeks from now." 3
The market repricing was sharp. The 2-year Treasury yield surged 14bps to 4.19%. CME FedWatch placed the probability of a July hike at 28%, up from 8% pre-decision; the probability of at least one hike in 2026 rose to ~80%. The Nasdaq and S&P 500 each fell more than 1% near the close. 4
One complication for the hawkish read: oil prices have dropped roughly 30% since the March dot plot, with Brent now near pre-Iran-conflict levels after the peace deal signed last week. Quinn Thompson (Lekker Capital, Chief Investment Officer) argued the Fed appeared to be "fighting the last war" — pivoting hawkish precisely as its main inflation driver recedes. 4 The Warsh committee's own language acknowledged inflation reflects "supply shocks that have driven price increases in certain sectors, including energy" — a description that fits a problem now partially resolved. 3
Warsh's commitment framing was direct: "The commitment to deliver is strong, unanimous, and unambiguous, and that's I think an important message we've missed for five years, and we're going to fix that." 1
BTC/ETH: Post-FOMC dip, orderly rather than a rout
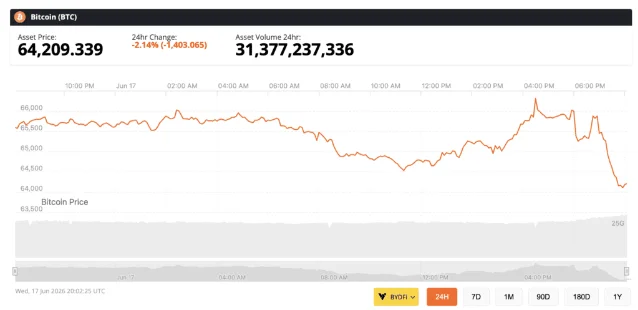
BTC at $64,324 (−1.27% 24h, +2.24% 7d) held above $64,200 as of the 13:00 UTC Day 23 window close. 5 The intraday session low of ~$64,200 came during the post-announcement window — a 1.6% single-session pullback from the $65,500 pre-decision level. BTC's bounce from the June 5 cycle low (~$59,200) has now stalled just below the quarterly open at $68,266. The 24h pace of decline improved slightly from Day 22's −1.84%.
ETH at $1,748 (−0.66% 24h, +5.94% 7d) is outperforming BTC on the 7-day timeframe despite the shared post-FOMC dip. 6 The 24h pace eased sharply from Day 22's −2.35%.
Jason Jones at Brave New Coin framed the reaction: "The one consolation for crypto is that none of this is a surprise anymore. The market has spent a month bracing for exactly this, which is why the reaction has been orderly rather than a rout. The real test comes at the July meeting." 4
Fear & Greed at 15 (Extreme Fear) — a 7-point drop from Day 22's 22 — is the lowest reading since this tracking window began. 7
ETF flows (Jun 17): FOMC reverses prior-day inflows
BTC spot ETFs saw −$82.2M net outflow on FOMC decision day (Jun 17), reversing the prior session's +$10.2M inflow in full. 8
| Fund | Jun 17 flow | Jun 16 flow |
|---|---|---|
| ARKB (ARK/21Shares) | −$43.5M | $0 |
| IBIT (BlackRock) | −$30.8M | +$16.4M |
| GBTC (Grayscale) | −$15.5M | −$16.8M |
| BTCO (Invesco) | −$6.4M | $0 |
| HODL (VanEck) | −$4.1M | $0 |
| FBTC (Fidelity) | +$14.0M | +$4.3M |
| MSBT | +$4.1M | +$1.9M |
| All others | $0 | varied |
| Net | −$82.2M | +$10.2M |
FBTC (Fidelity) was the only major fund to hold positive flows on FOMC day, adding +$14.0M against the broader tide. ARKB flipped from zero to the session's largest single-fund outflow at −$43.5M. 8
ETH spot ETFs saw −$29.3M net outflow, reversing the prior day's +$9.6M. 9 Outflows were broad: 7 of 10 funds negative, with the Grayscale mini trust (ETH) leading at −$9.9M and ETHA (BlackRock) flipping from +$17.3M on Jun 16 to −$9.0M on Jun 17. Combined BTC+ETH ETF net: −$111.5M on FOMC decision day.
On Jun 16 (last data before FOMC), SOL spot ETFs added +$245.9K and XRP +$5.3M — both modest. SOL cumulative stands near $1.45B; XRP near $1.44B. 10
USDe and Aptos: the two exceptions
Within a uniformly negative Day 23, two signals moved against the trend.
USDe (Ethena's synthetic yield-bearing dollar, delta-hedged against crypto positions) reached $4.506B across all chains, adding +$15.9M on the day. 2 USDe is the only Big-5 stablecoin (USDT/USDC/DAI/USDS/USDe) in sustained growth over the 7-day and 30-day windows — up +$29.7M and +$158.9M respectively. USDS (Sky Protocol's stablecoin, formerly Maker's rebranded dollar) continued contracting at −$16.8M to $8.171B; its 7-day drain is −$270.6M, 30-day −$670.6M. The gap between USDe ($4.506B) and USDS ($8.171B) is now $3.67B and narrowing.
USDe on Base hit $155.6M on Day 7 (Day 1 was $1.4M) — seven days of growth from near-zero to $155M. Day 7 growth slowed to +$2.4M from Day 6's +$13.3M, consistent with an S-curve entering its inflection from rapid growth to plateau. 2
Aptos posted +$85.8M in combined USDT+USDC inflows against the broader de-risking trend — USDT +$49.9M to $1.056B and USDC +$35.9M to $177.8M. 2 The combined Aptos stablecoin footprint stands at ~$1.23B. Whether this represents genuine on-chain demand for Aptos-native protocols or operational moves by a small set of wallets is not resolvable from supply-level data alone.
Regulatory
CLARITY Act (crypto market structure bill): Arca's managing director David Nage estimated the bill is 80–85% complete as of mid-June. A Senate floor vote may come as early as after Congress returns from recess on July 13, with the White House targeting a House vote by July 4. The remaining sticking point is ethics language barring government officials from profiting from crypto-related activity while in office — the core policy framework is largely agreed. 11
BPI on CLARITY Act: The Bank Policy Institute published "Closing AML/CFT Gaps in the Clarity Act" on June 17, identifying three gaps: (1) not all Digital Asset Service Providers (DASPs — a category covering custodians, service providers, unhosted wallets, and DeFi developers) are subject to Bank Secrecy Act obligations; (2) Treasury lacks clear authority to sanction mixers and tumblers; (3) no economic benefit test exists to determine when DeFi protocol operators should be treated as financial institutions. BPI's stated position: "These gaps are not innovation-friendly; they are illicit finance-friendly." 12
Tokenized Treasuries hit $15.01B as of June 17, up from $14.95B the prior day, per RWA.xyz. DTCC announced it will begin production testing of tokenized stocks, ETFs, and Treasuries in July 2026. 13
BlackRock BITA ETF: BlackRock launched the iShares Bitcoin Premium Income ETF (Nasdaq: BITA) on June 16 — a covered-call strategy targeting 15–25% annual income yield by writing options on BTC and IBIT exposure. No first-day flow data was available as of this window's close. 14
Strategy (MSTR): Holdings remain 846,842 BTC as of the June 15 filing (1,587 BTC purchased Jun 8–14 at ~$63,024 average). No new filing between June 15 and June 18. BTC Yield year-to-date: 12.5%. 15
Signal read
The post-FOMC stablecoin reaction is the most bearish reading in this 23-day series. Big-3 burned −$760.4M — 3.1× Day 22's pre-FOMC drain — with USDT and USDC both accelerating simultaneously. Ethereum USDT's −$343.2M is the largest single-day Ethereum USDT outflow in the recent tracking period. Tron USDT's 3-day pause ended with a −$162.0M session. Combined BTC+ETH ETF outflows of −$111.5M on FOMC day confirm the same de-risking direction in the institutional flow channel. Fear & Greed at 15 is 7 points below Day 22 — seven days into Extreme Fear territory. 2 7
Two interpretations of the hawkish dot plot are in tension. The consensus read: the FOMC just told markets rates are going up, not down, in 2026 — a direct headwind for risk assets dependent on cheaper money. The counterargument, made by Quinn Thompson at Lekker Capital: the committee pivoted hawkish precisely as oil — its main inflation driver — has dropped 30% since March, which may mean the dot plot overstates the actual need for hikes. Warsh himself gave the dots plenty of eraser room: "my colleagues around the table... understand the world is changing quite quickly and they didn't feel bound by them six weeks from now." 3 The next concrete test is the July FOMC meeting — July hike probability repriced from 8% to 28%.
Arbitrum USDC is the one structural deceleration signal worth watching. Three consecutive sessions of shrinking outflows (−$131.6M → −$20.3M → −$8.6M) suggest the chain-level de-risking is approaching exhaustion, even as the broader market bleeds. A Day 24 Arbitrum USDC print near zero or positive would be the first confirmation that any segment of the market has stopped responding to the FOMC shock. 2
The key reversal trigger remains Ethereum USDC stabilization. Days 20–22 produced a three-session +$600M net recovery on Ethereum USDC from the Day 18 trough, including the +$621M Day 21 spike. Day 23 prints −$117.1M — 5.7× worse than Day 22. Until Ethereum USDC finds a stable footing (two consecutive sessions without acceleration in the negative direction), the on-chain liquidity signal stays bearish. The secondary trigger: any Fed speaker walking back the hawkish dot plot interpretation ahead of July.
Supply data: DeFiLlama Stablecoins API (Jun 18, ~13:00 UTC). BTC/ETH prices: CoinPaprika (Jun 18, ~13:08–13:09 UTC). Fear & Greed: Alternative.me API (Jun 18, timestamp 1781740800). BTC/ETH ETF flows: Farside Investors (Jun 17 data). Chain-level changes compare Day 22 (Jun 17, 13:00 UTC) vs. Day 23 (Jun 18, 13:00 UTC) snapshots. Permanent data gaps: whale wallet events (Whale Alert down), cross-chain bridge flows (DeFiLlama Bridges paywalled), exchange on-chain stablecoin balances (CoinGlass JS-rendered, paid API required).
参考来源
- 1CNBC: Fed holds rates steady, June 2026
- 2DeFiLlama Stablecoins API
- 3Reuters: Warsh skips dot, launches communications review
- 4Brave New Coin: Bitcoin and stocks hit session lows
- 5CoinPaprika: Bitcoin price
- 6CoinPaprika: Ethereum price
- 7Alternative.me: Fear & Greed Index
- 8Farside Investors: Bitcoin ETF flows
- 9Farside Investors: Ethereum ETF flows
- 10KuCoin News: Crypto ETF inflows Jun 16
- 11Yahoo Finance/CryptoProwl: Senate CLARITY Act vote
- 12BPI: Closing AML/CFT gaps in the Clarity Act
- 13RWA.xyz: Tokenized U.S. Treasuries
- 14Yahoo Finance: BlackRock BITA launch
- 15Strategy: Bitcoin purchases


围绕这条内容继续补充观点或上下文。