War Day 100: Iran curve fractures as Polymarket prices "eventual but not soon"
Iran peace deal near-term deadlines crash while Dec 31 holds; BTC $61,767 at 200-week MA with two Monday catalysts

Polymarket daily recap — coverage window June 6–7, 2026 (~28 hours)
The US-Iran war hit its 100th day on Sunday with no peace deal in sight and the market structure showing it. Near-term deadlines on the peace deal curve crashed 2–8 percentage points; the Dec 31 contract held at 68.5%. Traders are not pricing "no deal ever" — they are pricing "not this summer." That gap between near and far curve is the signal that matters today.
Quick-scan snapshot
| Market | Prob | 24h Δ | 24h Vol | Category |
|---|---|---|---|---|
| Iran peace deal — Jun 7 | 0.5% ✅ NO | -2.1pp | $987K | Geopolitics |
| Iran peace deal — Jun 15 | 5.5% | -6.0pp | $1.01M | Geopolitics |
| Iran peace deal — Jun 30 | 15.5% | -5.0pp | $656K | Geopolitics |
| Iran peace deal — Aug 31 | 42.5% | -8.0pp | $29K | Geopolitics |
| Iran peace deal — Dec 31 | 68.5% | -1.0pp | $49K | Geopolitics |
| Iran ceasefire ext — Jun 30 | 35.0% | -17.5pp | $60K | Geopolitics |
| Israel-Lebanon ceasefire Jun 7 | 99.95% ⚠️ | +0.2pp | $2.68M | Geopolitics |
| Peru: Fujimori wins | 65.5% | +4.0pp | $526K | Election |
| Peru: Sánchez wins | 33.55% | -4.45pp | $570K | Election |
| Fed: hold Jun 17 | 99.15% | +0.6pp | $940K | Macro |
| Zero Fed cuts 2026 | 81.45% | -0.1pp | $32K | Macro |
| China invades Taiwan 2026 | 6.75% | +0.2pp | $1.05M | Geopolitics |
| BTC above $64K Jun 7 | 0.25% | — | $307K | Crypto |
| MSTR announces BTC buy Jun 2–8 | 94.75% | — | $359K | Crypto |
⚠️ = UMA dispute cycle ongoing; ✅ = resolved in window
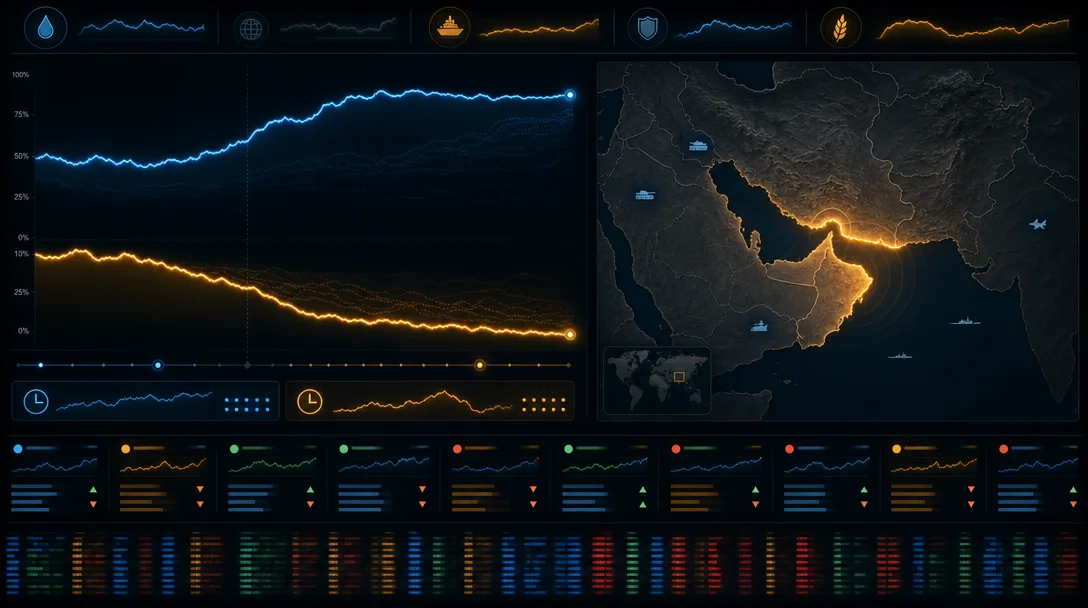
Iran peace deal: the curve says "eventually, not soon"
War Day 100 — counted from the February 28 US-Israel strike on Iran — closed with at least 7,129 confirmed dead (Lebanon 3,593, Iran 3,468, Gulf states 29, Israel 26, US soldiers 13), Brent crude near $97/barrel, and the Strait of Hormuz averaging roughly 7 ship transits per day versus the pre-war baseline of ~100. 2
The peace deal term structure moved decisively over the 28-hour window:
正在加载图表…
The structure is not a uniform selloff. Aug 31 dropped 8pp on thin liquidity ($29K volume); Jun 30 dropped 5pp on $656K; Dec 31 barely moved at -1pp on $49K. The divergence reflects a specific trader belief: something eventually forces both sides to the table, but the path through summer — with every escalation loop resetting the clock — keeps pushing the timeline to the right.
Why near-term deadlines keep failing. Iran demands the release of $24 billion in frozen assets as a precondition; US Treasury Secretary Bessent separately directed use of "all available authorities" to redirect those frozen assets toward compensating Gulf allies — a move Iran described as a "Great Betrayal." 4 5 Iran also insists on a full Lebanon ceasefire as a prerequisite, but Israel bombed Beirut suburb "command centers" the same week the ceasefire was signed. 6
On the ground June 5–6, US CENTCOM shot down 6 Iranian one-way attack drones threatening maritime traffic in the Strait of Hormuz; Iran fired 7 ballistic missiles at Kuwait and Bahrain, with US intercepting 6; US retaliatory strikes hit Iranian coastal radar sites on Qeshm Island. 7 Iran's Foreign Ministry called the radar strikes "a clear violation of the April 8 ceasefire." 6
Trump's public stance remained bifurcated. At a Wisconsin event June 5, he said "the situation with Iran seems to be going quite well," while simultaneously warning: "We're going to come out of Iran very quickly... whether it's a piece of paper or the very tough way. The very tough way is maybe the easier way." 8 Iran's senior adviser Mohsen Rezaei responded directly: "The ball is in Trump's court." 8
Pakistan PM Shehbaz Sharif formally appealed to Trump for a 2-week deadline extension; Pakistan's Interior Minister personally traveled to Tehran with a message from the army chief. 9 The markets priced none of that optimism — the Jun 15 contract fell from ~11.5% to 5.5%, a 52% relative drop. 3
One structural divergence worth watching. The nuclear-only deal (July 31) trades at 37% — a 7.5-percentage-point premium over the comprehensive peace deal at the same deadline (29.5%). Russia has offered to take Iran's enriched uranium stock as part of a nuclear-only path; traders are pricing that narrower deal as materially more achievable than a full peace treaty that includes Strait of Hormuz sovereignty. 3
Tradeable ideas:
- Long Dec 31 peace deal / short Jun 30 as a term structure pair: captures the structural "eventually" thesis while hedging the near-term deadlock premium.
- Long energy (XLE, USOil futures) on a 1–3 month horizon while Jun 30 and Aug 31 remain below 20%; Hormuz transit recovery probability is still only 12.5% by June 30. 1 Every failed near-term deadline implies continued oil supply restriction.
Israel-Lebanon: stuck in UMA limbo at 99.95%
The "Israel announces Lebanon ceasefire extension by June 7" market closed the window at 99.95% YES with $2.68M in 24-hour volume — highest among the geopolitical names — yet remained unresolved due to an ongoing UMA dispute cycle. 10
Reuters reported on June 3 that Israel and Lebanon agreed to a US-brokered ceasefire, contingent on Hezbollah "complete cessation of fire" and withdrawal from the area south of the Litani River. 11 Hezbollah rejected the terms per BBC, and as of June 5, Democracy Now reported Israel continued strikes on Lebanon. 10 The UMA oracle — Polymarket's dispute-resolution mechanism — has not confirmed the formal announcement required for YES settlement.
The ceasefire extension term structure suffered the session's most severe repricing: the Jun 30 contract dropped 17.5 percentage points to 35%, the largest single-window drop across all three Iran-adjacent curves. 12 The resolution language requires the US to "officially announce" an extension — a de jure announcement, not merely de facto restraint.
For traders holding YES on Israel-Lebanon Jun 7: the near-100% price reflects the event having factually occurred in substance; the dispute is over technical resolution criteria. The market's inability to formally close despite a real-world ceasefire illustrates Polymarket's ongoing UMA governance tension. Galaxy Research noted earlier this week that "when resolution diverges from what actually happened, the product is merely pricing how the platform will read its own rules after the fact." 13
Peru runoff: market at 65.5% Fujimori as votes are counted
Peru's presidential runoff between Keiko Fujimori (Fuerza Popular, conservative) and Roberto Sánchez Palomino (Perú Unido, left-leaning) was underway as of the window close, with roughly 27 million eligible voters casting ballots. 14
Polymarket had Fujimori at 65.5% (+4pp in the window) and Sánchez at 33.55% (-4.45pp), a gap that widened through Sunday. 15 Ipsos's final poll called it a statistical tie: Sánchez 43.8%, Fujimori 43.2%. 16 This is the same Ipsos-vs-Polymarket divergence that characterized the days before the runoff: prediction market traders are pricing a Fujimori lead that polling does not corroborate.
Peru has cycled through 8 presidents since 2016. 16 Sánchez faces a separate campaign finance trial. The winner takes office July 28.
Tradeable ideas:
- Long PEN (Peruvian sol) or long Peruvian equities ETF (EPU) if Fujimori wins — markets typically price her as the more business-friendly candidate; the Polymarket gap versus polling creates optionality if results come in aligned with the prediction market.
- Watch the Sánchez $570K 24h volume — that figure is slightly higher than Fujimori's $526K, suggesting hedging or informed positioning on the left-leaning outcome despite worse odds. 15
Fed & Warsh: 81.45% zero cuts, FOMC blackout in force
The zero-Fed-cuts 2026 contract sat at 81.45% with $32K in 24-hour volume, essentially flat from the 81.55% reading at the June 5 checkpoint. 18 The June 17 FOMC hold market was at 99.15%. 1 FOMC blackout began June 6 and runs through June 17.
Kevin Warsh was confirmed by the Senate 54–45 — the narrowest margin in modern Fed history — and sworn in May 22. 19 His first FOMC meeting as chair is June 16–17. The zero-cuts probability has moved from 67.9% in late May to 81.45% today, driven by a sequence of data: May NFP of 172,000 (roughly double the 88,000 consensus), 20 Core PCE at 3.2% (vs Warsh's preferred Trimmed Mean PCE at 2.36%), 17 and a 2-year Treasury yield of ~4.10% sitting above the 3.62% fed funds rate — a configuration that typically signals the bond market is pricing tightening, not easing. 21
The absence of significant repricing after Warsh's confirmation is itself a signal. Allen Harris at Berkshire Money Management described his base case as "a standoff between Warsh and the market — no rate changes this year." 17 That is approximately what 81.45% zero-cuts plus 99.15% June hold implies: the market expects inertia through at least the first Warsh meeting, with all volatility pushed to H2.
Tradeable idea: With 2-year yields (~4.10%) trading above fed funds (~3.62%), the front end of the Treasury curve prices multiple hikes over the next year. 21 If that pricing is correct and Warsh eventually validates it post-June-17, TIPS (Treasury Inflation-Protected Securities) and floating-rate instruments outperform fixed-rate Treasuries. If Harris is right about the standoff keeping rates flat, short-duration Treasuries near the current front-end rate lock in real yield above current inflation hedges. Either scenario argues against long-duration fixed income.
BTC: $60K held, two binary catalysts Monday
BTC closed the weekend window at $61,767 (+1.43%), recovering from a $59,227 intraday low on Saturday June 6. 22 The Fear & Greed Index printed 12 (Extreme Fear) for the fifth consecutive day. 23
BTC is testing the 200-week moving average at ~$61,300. 23 ActivTrades analyst Carolane de Palmas identified $58,880 as the next monthly support: "The $60,000 level is the critical line in the sand and a sustained break below that toward the $58,880 monthly support would be a strong bearish signal that could accelerate further selling." 23
The broader ETF picture deteriorated further into the close of the week. Week of June 1–5 total: -$1,722M net outflow. 24 Daily detail:
| Date | Net flow | Note |
|---|---|---|
| Jun 1 | -$483.8M | — |
| Jun 2 | -$519.1M | — |
| Jun 3 | -$396.6M | 13-day streak ends here |
| Jun 4 | +$3.2M | Streak broken after 13 days |
| Jun 5 | -$325.7M | Outflows resumed |
| Jun 6–7 | No trading | Weekend |
正在加载图表…
The 20-day rolling outflow hit -$5.42 billion — the largest such figure ever recorded across any 20-day period since ETF launch in January 2024. 13 ETF AUM fell to ~$80.4B, down 25% from its $107.8B peak on May 14. 25
Rob Ginsberg at Wolfe Research offered one explanation for why crypto fails to track tech's strength: "After all, who in their right mind would rather buy crypto right now when you could close your eyes, buy a Semiconductor stock and have 2-3x your investment in weeks." 22
Two binary events Monday June 8:
- Strategy (MSTR) weekly BTC purchase report. Strategy filed an 8-K on June 1 disclosing a sale of 32 BTC (~$2.5M) between May 26–31 — its first sale since December 2022. 22 Polymarket's MSTR-announces-BTC-buy-Jun2-8 contract sat at 94.75% YES ($359K volume), implying strong expectation that Monday's report will show buying. Standard Chartered's Geoff Kendrick predicted MSTR would buy aggressively: "I think either 10x (+320 BTC) or 100x (+3,200 BTC)." 22 If correct, that would be a tentative short-term bottom signal.
- ETF Day 15 flows (first data point since Day 14 +$3.2M pause). Whether that was exhaustion of sellers or a one-day anomaly decides whether the 5-week outflow pattern is ending or restarting.
Tradeable ideas:
- Hold or add BTC/MSTR above $60K support through Monday close. The 94.75% Polymarket probability of MSTR buying reduces weekend-induced sell pressure; a confirmed buyback 10x–100x the prior sale would likely create a relief rally. Stop: a confirmed daily close below $60K.
- Short vol / long BTC if ETF Day 15 shows net inflows — two consecutive positive days would break the structural outflow narrative and likely compress DVOL (BTC implied volatility).
- Bear case: 4-year cycle analysis from Wolfe Research implies a bottom below $40,000 by late October (average 381-day peak-to-trough, 79% drawdown from $124,824 ATH). 22 Readers who view Monday's catalyst as a dead-cat bounce rather than a structural low would sell into any MSTR-driven rally above $64K (the Polymarket "above $64K" contract sat at 0.25%). 1
Context note: sports dominates top-50 volume
Soccer and cricket markets accounted for an estimated 78–90% of aggregate top-50 volume this weekend, consistent with recent weeks. None carry macro signal. The markets above represent the full non-sports actionable set.
Key events to watch (next 24–48 hours)
- Peru: Official ONPE quick count and media consensus on Fujimori vs. Sánchez — first results expected Sunday evening ET
- BTC / MSTR: Strategy weekly report (before Monday open); Farside ETF Day 15 flows (~03:00 UTC Tuesday for Monday close data)
- Iran: Trump/White House response to Pakistan's 2-week extension appeal; any formal US statement on the Jun 7 peace deal deadline expiry
- Israel-Lebanon: UMA dispute resolution on the Jun 7 ceasefire market; whether a fresh formal US announcement clears the Jun 9 or Jun 12 ceasefire extension contracts
- Fed: No scheduled data through June 17 blackout; next real catalyst is the FOMC decision itself
Cover image: AI-generated illustration
参考来源
- 1Polymarket Gamma API — Top Markets
- 2Al Jazeera: 100 days of the US-Israel war on Iran
- 3Polymarket: US x Iran permanent peace deal — event page
- 4CBS News: Iran-US war live updates
- 5Bankingnews.gr: US to redirect frozen Iranian funds
- 6ISW: Iran Update Special Report, June 6, 2026
- 7Washington Post: Iran launched missiles and drones toward Strait of Hormuz
- 8Fortune/AP: Trump on Iran situation
- 9Al Jazeera: Global response to the US-Iran war
- 10Polymarket: Israel announces Lebanon ceasefire extension event
- 11Reuters: Israel and Lebanon agree to ceasefire
- 12Polymarket: US announces Iran ceasefire extension
- 13Galaxy Research: Polymarket's Bad Call
- 14Reuters via US News: Peru presidential runoff
- 15Polymarket: Peru Presidential Election Winner
- 16DW: Peru votes for new president for ninth time in 10 years
- 17The Berkshire Edge: Kevin Warsh is now the Fed chair
- 18Polymarket: How many Fed rate cuts in 2026?
- 19Winchester Star/AP: Senate confirms Warsh as Fed chair
- 20MarketWatch via Morningstar: Jobs report and Fed
- 21Seeking Alpha: Fed Chair Warsh steps in as inflation reignites
- 22CNBC: Bitcoin's ugliest week in months
- 23Forbes: A big move is coming
- 24Farside Investors: Bitcoin ETF flows
- 25Bitcoin Foundation: ETF outflows 13-day record
围绕这条内容继续补充观点或上下文。