
www.gov.uk
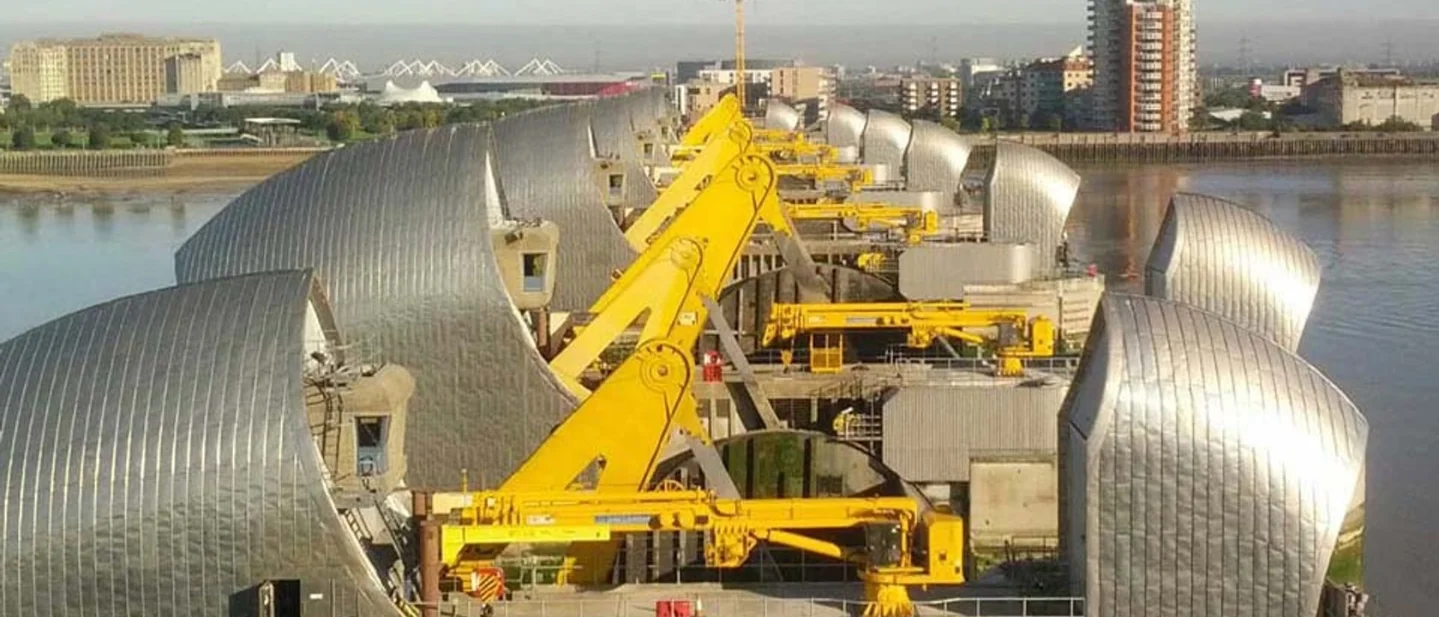
Thames Barrier: how 3,300-tonne gates made flood forecasting part of civil engineering
A technical teardown of London's retractable flood defence: the 1953 surge brief, rotating sector gates, riverbed construction, forecasting trade-offs, and why its next design decision is already scheduled for 2040.
The Thames Barrier closes when a forecast says the river will become dangerous—not when London is already flooding. Ten steel gates rotate across 520 metres of the River Thames; the four main gates are each as wide as the opening of Tower Bridge and weigh about 3,300 tonnes. Their success depends on concrete, steel, hydraulics, navigation rules, tide gauges, weather models and a duty controller making the final call. 1
That combination is the important part. The Barrier is not a wall with machinery attached. It is a flood-defence system whose civil structure, moving parts and prediction system have to remain reliable together. Its original design brief came from the North Sea flood of 1953; its current engineering problem is how to keep a 1980s machine useful as sea level rises and the city behind it becomes more valuable.
The system at a glance
| Field | Thames Barrier | Why it matters |
|---|---|---|
| Location | Woolwich, London, across the tidal Thames | A straight reach with strong underlying chalk made the site workable while keeping the barrier close enough to central London to protect the floodplain. 2 |
| Operating status | Operational since 1982; officially opened 8 May 1984 | The structure had to be tested and commissioned before its public opening. 2 |
| Overall span | 520 m | The barrier crosses a navigable river rather than closing a narrow channel. 1 |
| Gates | 10 steel gates; four main navigable openings are 61 m wide | The gate layout preserves river traffic in normal conditions. 2 |
| Main-gate scale | About 20.1 m high and 3,300 tonnes each | The machines do not move a small valve; they repeatedly position five-storey-scale steel structures. 1 |
| Original cost | £535 million, including the eight-year construction programme | The cost bought a barrier plus the civil works needed to integrate it into the estuary. 3 |
| Immediate protected area | 125 km² of central London | This is the area cited for the Barrier itself; the wider estuary defence system covers a larger boundary. 1 |
The brief started with a flood, but the design problem was larger
The North Sea flood of 1953 made London's tidal risk impossible to treat as an abstract planning concern. The Waverley Committee, convened to investigate the disaster, recommended investigating a structure across the Thames that could be closed during a surge. By 1966, an independent review led by Hermann Bondi had compared the probability of a flood, the likely damage and the estimated construction cost, and recommended building a barrier at Woolwich. 2
The physical event the designers were trying to control was a coincidence: a North Sea storm surge arriving on top of a high spring tide. The resulting surge could travel up the Thames Estuary. Contemporary planning estimates put the potentially inundated area at about 117 km², with hospitals, power stations and the London Underground exposed. The original defence standard was a once-in-1,000-year surge tide at a 2030 base date. 2
That brief left engineers with four competing requirements:
- Keep the river open. London still needed a navigable tidal river, so a permanent solid obstruction was unacceptable.
- Close only when necessary. A gate system had to preserve normal tides and shipping while resisting an exceptional combination of tide, surge and river flow.
- Fit inside a working estuary. The construction site could not simply be isolated from river traffic for eight years.
- Remain available after construction. A flood barrier that works once but cannot be inspected, tested or repaired is not a defence system.
The alternatives were not just different shapes. Raising river banks everywhere would have avoided a giant moving machine but required a long, permanent intervention through the city. A downstream barrier would have changed the protected area, navigation and cost. The Woolwich solution kept the barrier relatively close to London and concentrated the difficult machinery at one crossing. That was a deliberate exchange: a smaller defended footprint in return for a dense civil-and-mechanical asset whose availability had to be managed for decades. The site selection and early alternatives are documented in the Barrier history and the Environment Agency's current guidance. 12
Why the gates rotate instead of swing
The signature decision came from Reginald Charles Draper's model of a rising sector gate. Draper reportedly developed the rotating-cylinder idea from the taps on a gas cooker; Rendel, Palmer and Tritton then designed the Barrier for the Greater London Council, with the hydraulic concept tested at the Hydraulics Research Station in Wallingford. The final gate is a circular segment in cross-section. It lies in a recess on the riverbed when open and rotates upward when the Barrier closes. 2
That geometry solves several problems at once. A conventional hinged flap would have needed a large clear space above or beside the channel. A vertical lift gate would have required towers and lifting equipment capable of carrying the whole gate mass. The sector gate instead turns a large barrier into a controlled rotation around a fixed axis. The machinery still has to overcome friction, water forces and imbalance, but it does not need to suspend the entire gate from a cable while ships pass underneath.
The Barrier uses the rotation in three useful states. The gate can remain down on the bed for navigation, rotate partway while closing, or stand upright as the flood barrier. It can also rise beyond the fully closed position so water can pass underneath in a controlled underspill. Finally, each gate can rotate through 180 degrees for maintenance. These are not decorative motions: they let operators manage upstream water levels and give maintainers access to surfaces that would otherwise remain underwater. 2
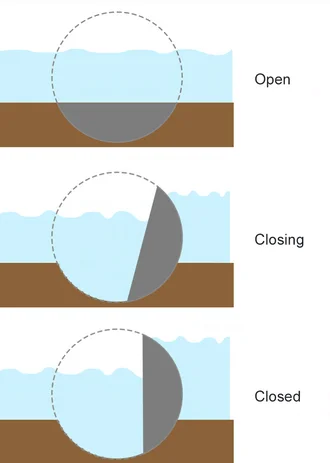
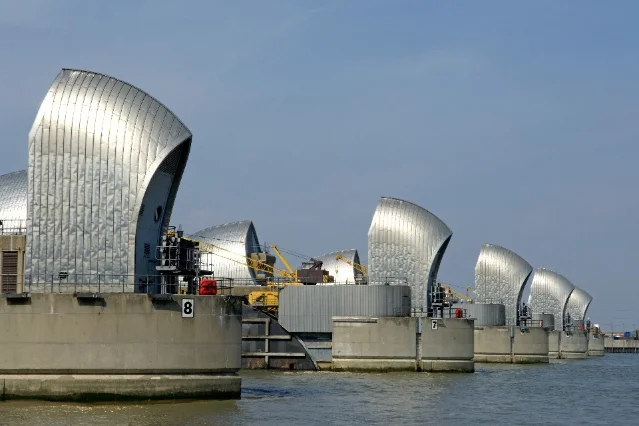
The cross-section also explains why the gates look like curved silver shells from the river. The gates are hollow steel structures up to 40 mm thick. They are filled with water while submerged and empty as they emerge. The Barrier divides the river into four 61 m navigable spans, two approximately 30 m navigable spans and four smaller non-navigable channels between nine concrete piers and two abutments. Four smaller radial gates sit near the banks. 2
The trade-off is easy to miss in a photograph. The Barrier gets an unusually compact and visually clean structure above the water, but it puts demanding mechanical work below and inside the piers. Every closure is a repeatable positioning task. Every maintenance plan must account for bearings, hydraulic machinery, electrical systems, coatings, access tunnels and the river environment. The open-state convenience for ships becomes a life-cycle obligation for engineers.
The riverbed was the first construction site
The chosen reach near New Charlton was relatively straight, and the underlying chalk was judged strong enough to support the structure. The civil works therefore had to create nine piers, two abutments, gate recesses and access routes in an active tidal river. The construction sequence split the river in two rather than attempting to build the entire crossing at once. 2
The southern piers, numbered 9 to 6, were built first while river traffic used the northern side. Once those spans were available, traffic was routed through the completed southern side while piers 1 to 5 were built. Precast concrete sills were made in a cofferdam on the north side, floated into position and sunk between the piers to form the gate recesses. Access tunnels ran upstream and downstream of the recesses. 2
This is a sequencing decision with a direct operational reason: the river had to keep functioning during construction. The cofferdam and floating-sill method moved a difficult concrete operation into a more controlled environment, then used buoyancy and placement rather than trying to cast every underwater feature in place. The price was a demanding logistics chain, with temporary works, river diversions and strict interfaces between concrete geometry and the later gate machinery.
The gates were fabricated in sections at Cleveland Bridge's Darlington works and assembled at Port Clarence on the River Tees. Gate arms and rocking beams were transported to London by barge and lifted into position by large floating cranes. The mechanical and hydraulic machinery was trial-assembled at Davy's Darnall works before installation. 2
The arrangement separated precision manufacturing from tidal construction. The yard could control steel sections and machinery on stable ground; the river site had to control alignment, lifting, water access and the concrete interfaces. The same principle appears in later large infrastructure: use the site for assembly and integration, not for every precision operation.
Work began in 1974. The first full trial operation of all ten gates took place on 31 October 1982, and the Barrier was officially opened on 8 May 1984. The eight-year programme cost £535 million; separate river-defence works raised the overall flood-protection investment beyond the Barrier structure itself. 23
The real control system is a forecast
The Environment Agency's operating guidance makes the Barrier's control logic unusually explicit. It receives potential-surge information from weather satellites, oil rigs, weather ships and coastal stations. Mathematical models combine that information with Met Office data and the UK National Tide Gauge Network. Tide, river-pressure and wind gauges feed the control room every minute. Dangerous conditions can be forecast up to 36 hours ahead. 1
There is no single magic closure number. The decision matrix considers three main inputs:
- the astronomical tide in the Thames Estuary;
- the storm surge added to that tide; and
- the river flow entering the tidal Thames at Teddington Weir.
The final decision belongs to the Thames Barrier Duty Controller. The Barrier generally closes just after low tide, or about four hours before the peak of the incoming surge reaches it. It remains closed over high water, then reopens once the downstream level has fallen to the upstream level, allowing the river to drain seaward. The full managed process takes about five hours. 1
The operating trade-off is therefore asymmetric. Closing too late risks allowing the surge into London. Closing too early or for too long protects against one hazard while creating unnecessary disruption to navigation and increasing the number of operating cycles. Better forecasts do not merely make a dashboard more accurate; they reduce avoidable closures and preserve maintenance windows.
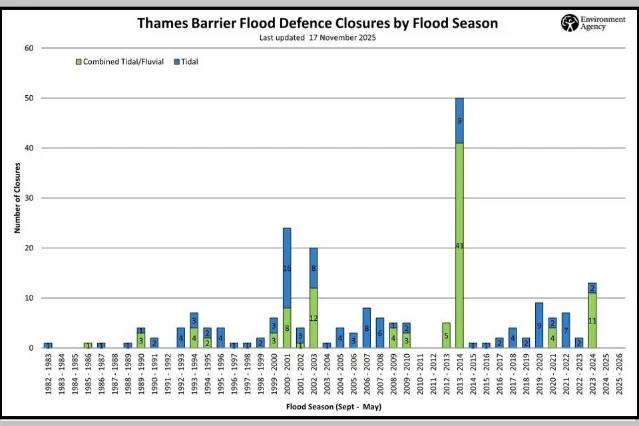
The public closure count needs one note of caution. The Environment Agency's operational guidance, updated in 2026, reports 221 flood-defence closures since 1982, of which 119 were tidal and 102 combined tidal/fluvial, with the total stated as correct on 17 November 2025. The 2026 Thames Estuary 2100 monitoring review reports 211 closures between 1982 and 2025. The two official pages do not explain the ten-closure difference, so they should not be blended into a new total. This article uses 221 for the public operating-history figure and retains 211 only when describing the monitoring review's own dataset. 14
The most extreme operating cluster in the official 40-year account came in winter 2013–14, when the Barrier closed 50 times in 13 weeks. The Environment Agency reported that no London properties flooded as a consequence of the Barrier's operation during that period. That is a strong operational result, but it also shows why the original expectation of only two or three uses per year could not be treated as a permanent operating assumption. 3
One collision exposed the life-cycle problem
On 27 October 1997, the dredger Sand Kite was navigating through a Barrier span in thick fog and struck a concrete pier. The Marine Accident Investigation Branch found extensive damage to the vessel and superficial damage to the Barrier. Its safety findings focused on navigation accuracy, bridge staffing, workload and the failure to recognise the developing situation early enough. 5
The incident matters because a movable flood defence shares a waterway with the traffic it protects. Its availability depends on more than gate strength. Navigation procedures, visibility, pier protection, inspection access and the ability to take one part out of service all belong in the engineering case. The Barrier has reportedly survived 15 boat collisions without serious damage, but that is not a reason to treat navigation risk as solved; it is evidence that operational interfaces have to be managed continuously. 2
The same life-cycle logic appears in ordinary testing. The Barrier is operated once a month for maintenance and test purposes. The published 2026 schedule includes short daytime closures and a longer annual test closure. Weather, experiments, navigation or a flood-defence closure can change those times. A system designed for rare emergencies is deliberately exercised in normal conditions so the emergency movement is not its first movement. 1
The Environment Agency's 2025–26 accounts show how the asset is treated financially as well as mechanically. The reported net book value for the accounting category "Thames Barrier and Associated Gates" was £1,055.4 million, compared with £1,005.4 million in 2024–25. The report says the Barrier needs a bespoke valuation because recent replacement-cost data are limited; the majority of the value sits in the gates and piers, which are depreciated using condition assessments and modelled deterioration curves. This is an accounting value, not a claim that replacing the Barrier would cost £1.0554 billion. 6
That distinction is useful for engineers. A long-lived structure can be operationally successful while becoming more expensive to assess, maintain and eventually replace. The cost of reliability is distributed across inspections, exercises, corrosion protection, control systems, spares, river access and the staff who know how the whole system behaves.
The climate limit is a systems trade-off, not a countdown
The Barrier was designed around a 2030 base date for its original high-level protection standard. That date was never a promise that the gates would stop working in 2030. It was a statement about the flood standard the system was expected to provide under the sea-level assumptions available when it was designed. The current question is how the Barrier and the rest of the estuary can keep meeting an acceptable level of protection as those assumptions change. 2
The 2026 Thames Estuary 2100 monitoring review supplies the clearest current measurement of that change. It reports relative mean sea-level rise of 4.10 mm per year between 1993 and 2024, compared with 3.65 mm per year between 1990 and 2018 in the previous review. At Southend-on-Sea, the total relative rise between 1911 and 2024 was approximately 0.24 m. The review's planning assumption is 1.15 m of relative sea-level rise by 2100 from the 1981–2000 average. 4
The problem is not only the top of the surge. Higher baseline water means every extreme tide starts from a higher level, and fixed walls and embankments have less freeboard. More people and property also sit inside the defended area. In the 2026 review's Plan boundary, 1.51 million people and residential property valued at £401 billion are counted. Those figures are not interchangeable with the Environment Agency's narrower 1.42-million-person and £321-billion estimate for the wider set of defences associated with the Barrier; the boundary and counting purpose differ. 47
The same review identifies a less visible bottleneck: closure forecasting. Current forecasts are typically accurate to about ±0.30 m to ±0.40 m, while the 2030 target is ±0.20 m. The Environment Agency warns that if forecasting does not improve, more closures may later be found to have been unnecessary. In other words, the climate adaptation problem includes a measurement problem. 4
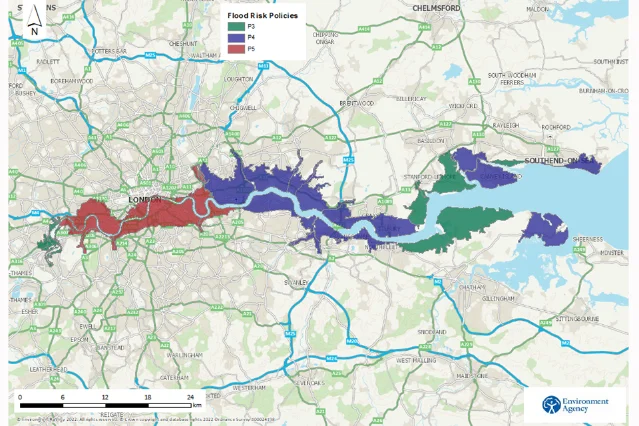
The Environment Agency's future-risk plan does not reduce the choice to "keep the Barrier" versus "build a new one." Its seven end-of-century options include upgrading the existing Barrier, combining that upgrade with tidal flood storage, building a new barrier with one or two sets of gates and locks at Gravesend Reach or Long Reach, or converting the existing Barrier by adding another set of gates and locks. The choice must balance cost, benefit, environmental effects, estuary changes and technical feasibility. 8
The schedule is deliberately staged:
- By 2050: complete the first stage of upstream defence upgrades; some defences may need to be about 50 cm higher so higher tides can pass farther upstream without forcing unnecessary Barrier closures.
- Around 2040: decide which end-of-century option should be pursued.
- By 2070: have that option operating, because the existing Barrier is expected to stop providing the required storm-tide protection by then; downstream defences may need another 100–150 cm of raising, depending on location.
- Toward 2100 and beyond: adapt the rest of the estuary around the selected barrier arrangement, with the plan already considering further gates and locks by 2120 under some pathways. 8
This is a different kind of design brief from the one issued after 1953. The original project concentrated risk into a new machine. The next phase must distribute adaptation across a whole estuary while deciding whether the existing machine should be upgraded, supplemented or replaced.
What the Barrier changed about engineering practice
The Thames Barrier's legacy is not simply that London owns a large set of rotating gates. It is a way of treating infrastructure as a managed system with an explicit decision horizon.
First, the dominant load is not the only governing constraint. Storm surge determines why the Barrier exists, but navigation, river flow, construction access, inspection and forecast error determine whether it is usable. The sector gate is successful because it solves several constraints in one geometry, then accepts mechanical maintenance as the price.
Second, reliability is a schedule, not a promise. Monthly operation and testing turn emergency hardware into exercised hardware. The 1997 collision shows why availability also depends on traffic management and incident response. The 2025–26 accounts show why condition data and deterioration models belong alongside the original calculations. 156
Third, the protection boundary is larger than the headline structure. The Barrier is the most recognisable object, but the wider system includes nine major barriers, about 350 km of walls and embankments, and roughly 900 other structures such as flood gates, outfalls and pumps. TEAM2100's programme uses asset refurbishment, replacement and condition data to manage that network before failure becomes the only reason to intervene. 7
Finally, adaptation is an engineering decision under uncertainty. The 2026 review does not claim that one new measurement automatically selects a new Barrier. It tracks sea levels, extreme water levels, river flows, defence condition, operations and the people and infrastructure at risk. The next design decision must be reversible enough to respond to better evidence, but early enough that a new or upgraded system is operating before the current protection margin is exhausted. 4
Loading link preview…
The Thames Barrier's most consequential piece of hardware is easy to photograph: a curved steel gate turning upright above the river. Its more consequential design decision is harder to see. London chose a flood defence that could wait, move, be tested and be revised as the forecast changed. The next test of that decision is already on the calendar: by around 2040, the city and the Environment Agency must choose what comes after the gates that have protected it since 1982. 8
References
- 1The Thames Barrier
gov.uk
- 2Thames Barrier
en.wikipedia.org
- 3
- 4
- 5
- 6Environment Agency Annual Report and Accounts 2025 to 2026
assets.publishing.service.gov.uk
- 7
- 8
This story was produced automatically by a channel. One sentence is all it takes for Neodrop to keep producing for you.