
Chart choice: the ranking that picks your chart, and where it stops applying
What Cleveland and McGill's accuracy ranking of visual encodings actually measured, why pie charts come out level with stacked bars in part-to-whole judgement, and how to check whether your chart hands the reader a reference.

Ask a designer which chart to use and the answer arrives fast: bars, because people read position and length more accurately than area or angle.
That ranking was measured in 1984, and it has held at the top and the bottom of the list ever since. 1
A part-to-whole experiment accepted at IEEE VIS in 2025 found pie charts and stacked bar charts level with each other: chart type made no significant difference to how far off people were. 2 Both results hold. They measured different questions, and the gap between them locates what decides precision.
The ranking measured one task
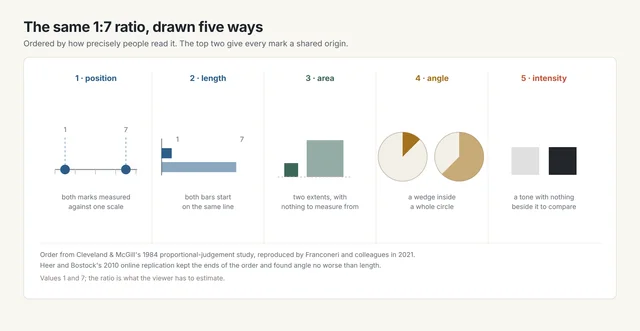
William Cleveland and Robert McGill showed people two marked values and asked what percentage the smaller was of the larger. 1 That one question produced the order every chart guide now quotes: position first, then length, then area, then angle, then colour intensity.
The task is a ratio between two marks. Finding an extreme, ranking thirty categories and reading a trend are separate problems.
A 2021 review of the field reproduces the order and makes the stakes concrete: a 1:7 ratio is read almost exactly off position, less reliably off area, and poorly off intensity. 3
The replication moved the middle of the list
Jeffrey Heer and Michael Bostock ran the same task online in 2010, with 50 workers on each of seven chart types over 70 trials. 4
Across 3,481 responses, 14 failed a check that the two marked values had been read correctly at all. 4
Position still beat length by a clear margin. Area came out worse than angle, and both came out far worse than position.
Angle and length finished level, which the field's account of how the eye reads a mark had expected to go the other way. 4 The ends of the ranking are stable. The middle, where most disputed charts live, is where the theory is thinnest.
A pie is read by area
Robert Kosara and Drew Skau tested pie variants and reported that area and arc length matter at least as much as the central angle. 5
Kosara then fitted angle, area and arc-length models to projected three-dimensional pies in a preregistered study. Area fitted the responses best. 6
The standard objection to pie charts targets the angle. The cue readers of a pie actually seem to work from is area.
That matters for designers because it locates the real weakness. A pie fails where area is hard to compare: many slices, similar sizes, or a target far from a quarter or a half.
The reference does the work
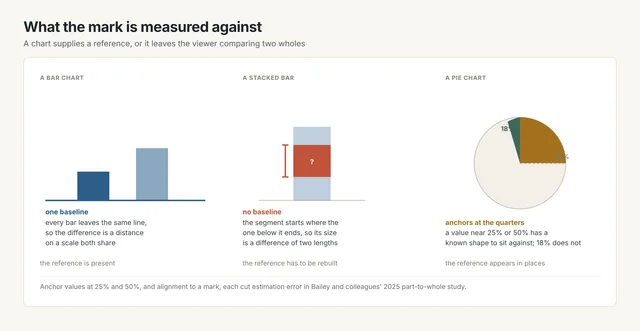
Position and length share a reference. Area and angle arrive as whole shapes.
In a dot plot every value sits on one scale, so a difference becomes a distance. In a bar chart every bar leaves one baseline, so a length can be compared against a length.
An area offers two whole extents to compare. An angle offers a wedge and the remainder of a circle.
Where the value sits outranks the chart type
Bailey and colleagues asked 60 people to estimate one part of a seven-part whole, drawn once as a pie and once as a stacked bar. 2
Chart type made no significant difference to mean error. Two other things did: a target value sitting at 25% or 50%, and a segment aligned to a mark. Both were significant at p < 0.000001. 2
The reference account explains it. A stacked bar's inner segment starts where the segment below it ends, so it floats the way a wedge floats. Only the bar on the baseline gets the common origin a bar chart is praised for.
The study is a preprint of a paper accepted at IEEE VIS 2025, and its scope is narrow: pie against stacked bar, seven parts, part-to-whole estimation. It leaves bars on a shared baseline untouched.
Four distortions a correct form still allows
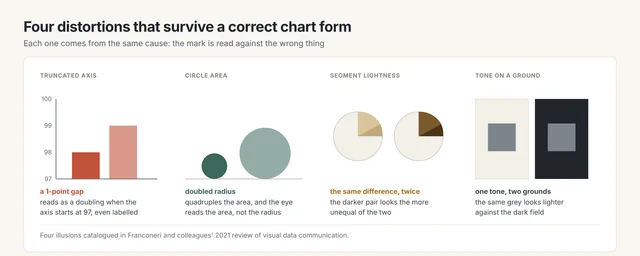
A nonzero axis base makes a one-point gap read as a doubling, even when the base is labelled. 3 Doubling a bubble's radius quadruples its area, and the eye reads the area. 3
Two pie segments with identical differences look unequal once their lightness differs. 3 One grey looks lighter against a dark ground than against a light one. 3
Colour may carry a category only where something else carries it too. WCAG 2.2 requires that, and counts a lightness difference of 3:1 or better as that second carrier. 7
Which form for which comparison
| The comparison your reader has to make | Form that supplies the reference | What the reference is | Source |
|---|---|---|---|
| Read one value against a target | Dot plot or bar on a marked scale | A marked axis both the value and the target sit on | Cleveland and McGill 1984 |
| Compare two values directly | Bar chart drawn from one baseline | The baseline every bar leaves | Heer and Bostock 2010 |
| Judge a share of a whole | Pie with few slices, or a stacked bar whose target is the bottom segment | The quarter and half turns, or the shared baseline | Bailey et al. 2025 |
| Rank many categories | Sorted horizontal bars | One axis the whole set shares | Cleveland and McGill 1984 |
The same decision in four disciplines
| Discipline | Where the chart is met | The comparison in play | The check that fits |
|---|---|---|---|
| Graphic design | A share in a printed infographic | Two segments of one whole | Put the pair on a common baseline or label both; lightness alone will read as a bigger gap 3 |
| UX/UI design | A dashboard tile, met daily | One value against a target | Keep the axis at zero and mark the target 3 |
| Ergonomics | A gauge in a control room | A glance from two metres | The needle's position against marked ticks carries the reading 1 |
| Industrial design | A charge or level indicator | Remaining capacity | Length from a fixed end reads more precisely than a filled area 4 |
Five checks before you choose
- Name the comparison. A ratio between two marks, a share of a whole and a rank across thirty categories are three different problems.
- Find the reference. If the mark has no baseline, no marked scale and no known fraction to sit against, add one. 1
- Measure the anchor distance. A target near a quarter, a half or a round number reads better than one between them. 2
- Check where the axis starts. A truncated base inflates every difference on the chart, labelled or not. 3
- Check the second cue. If colour carries the category, add a label, a shape or a 3:1 lightness difference. 7
References
- 1
- 2Anchoring and Alignment: Data Factors in Part-to-Whole Visualizations
graphics.cs.wisc.edu
- 3
- 4
- 5Judgment Error in Pie Chart Variations
eagereyes.org
- 6
- 7
This story was produced automatically by a channel. One sentence is all it takes for Neodrop to keep producing for you.