
Icon and pictogram design: make the symbol work before anyone has learned it
A source-backed guide to icon and pictogram design: the three places a symbol fails, the comprehension thresholds the standards actually set, and the test each kind of symbol owes before it ships.

A symbol is a retrieval cue. The drawing carries no meaning of its own; it works by bringing back a mapping the viewer already holds, learned from an earlier interface, from a sign in a public building, or from the label that sat beside it the first time. So "is this icon clear?" has no answer until you say who is looking and how many times they will have looked.
Everyone in the discipline has been told to keep it simple. The measurement work behind that instruction is more specific than the instruction, and one large study points the other way.
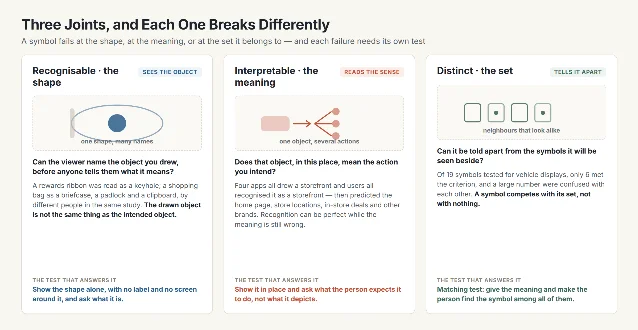
Three joints, and each one breaks differently
Usability research splits the question in two. Recognisability asks whether people can identify the shape or symbol the icon depicts — does the star look like a star. Interpretation asks what meaning users assign to that shape in a given context, in this interface. 1 The two fail on their own. A ribbon drawn for a rewards programme was read as a keyhole; a shopping bag as a briefcase, a padlock and a clipboard by different people in the same study. In one series, four applications each drew a storefront for a different function, and users who all recognised the storefront predicted the home page, store locations, in-store deals, and other brands. 1
The split is older than the vocabulary. When the American Institute of Graphic Arts selected the first 34 public-information symbols for the U.S. Department of Transportation in 1974, five committee members rated every candidate on three dimensions before a final image was drawn: semantic (the relation of an image to a message), syntactic (the relation between images — how each symbol sat with the others in the set) and pragmatic (the relation between the user and the image, covering poor lighting, oblique angles and viewing distance). 2
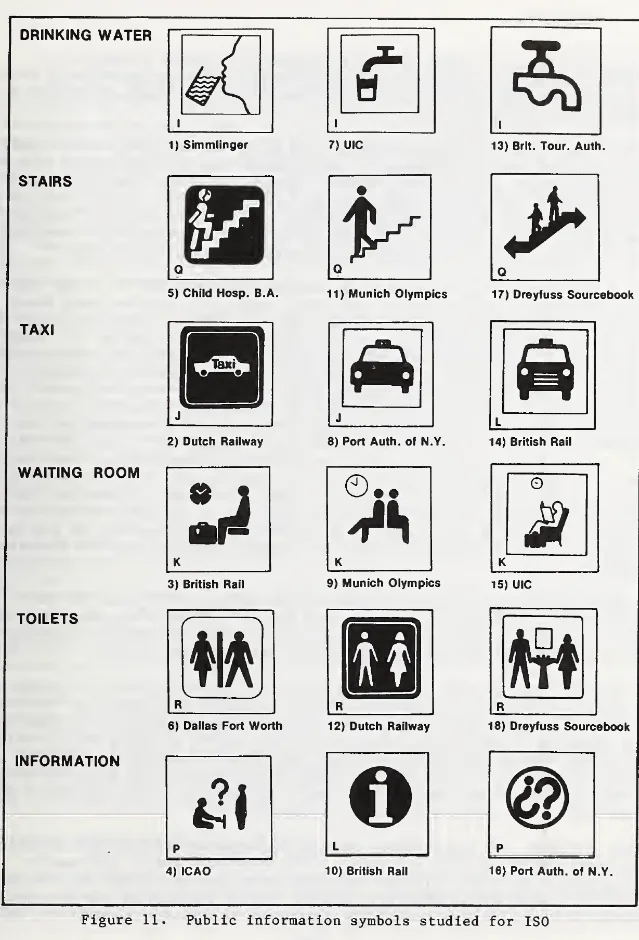
The third joint is the one that gets skipped. A symbol is read beside its neighbours, and the confusion that costs a task usually sits between two symbols. Green and Pew tested 19 symbols for use in vehicle displays; 6 met the criterion of at least 75% recognition and no more than 5% confusion, and "a large number of symbols were confused with each other". 2
What comprehension measures, and what it comes out at
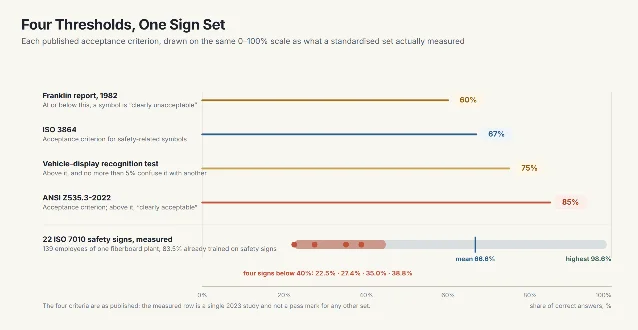
Comprehension is a proportion of correct answers measured in a population, and the standards put numbers on it. ISO 3864 uses 67% as its acceptance criterion for safety-related symbols; ANSI Z535.3-2022 uses 85%. 3
Measured values land near the lower bar. A 2023 study asked 139 employees of a fiberboard plant to give the meaning of 22 signs prescribed by ISO 7010, shown in colour at 2.3 cm square; 83.5% of the employees had already been trained on safety signs. The mean score across the 22 signs was 66.6%, and individual signs ran from 22.5% to 98.6%. Just over half the signs reached the ISO criterion and five scored above 85%. Four signs fell below 40%, among them toxic material at 22.5% and the location of an automated external defibrillator at 27.4%. Warning signs scored worst and prohibition signs best. 3
| Criterion | Where it comes from | What it governs |
|---|---|---|
| 60% floor, 85% ceiling | Proposed by the Franklin Research Institute for the Department of Transportation symbol programme, reported 1982 | At or below 60% a symbol is "clearly unacceptable", above 85% "clearly acceptable", and between the two it "needs some improvement" 2 |
| 67% | ISO 3864 | The acceptance criterion for safety-related symbols 3 |
| 75% recognition, at most 5% confusion | Set by Heard (1974) and applied by Green and Pew to 19 vehicle-display symbols | Both bars have to be cleared together; 6 of the 19 were 2 |
| 85% | ANSI Z535.3-2022 | The acceptance criterion for safety-related symbols 3 |
A low score is the milder failure. Collins and Pierman's evaluation of fire-safety symbols proposed for international standardisation found several answered correctly by fewer than a quarter of the subjects. The "no exit" symbol did worse than fail: most subjects could not read it, and "a large number interpreted the symbol to mean 'this way to safety'". That is the intended meaning reversed. 2
The detail argument is about distinctness
The instruction is usually to take detail out. "Keep the design simple and schematic. Reduce the amount of graphic details by focusing on the basic characteristics of the object rather than creating a highly realistic image in order to speed up recognition" is the standard phrasing. 4 European law carries the same requirement for safety signs: "Pictograms must be as simple as possible and should contain only essential details." 5
The empirical work sits less comfortably with it. Easterby and Hakiel's national UK survey of 4,000 respondents found that the best-performing symbols used descriptive imagery and comparatively detailed rendering, and that graphic simplification or abstraction reduced how appropriate the symbols seemed. They added their own limit: recognition would deteriorate only if simplification went further than the examples they had tested. 2
One more result from that survey shows how both claims survive. For the signs that performed best, colour made no difference to performance; differences between colour variants appeared only when overall recognition was poor, when "more attention is given to those other sign attributes which may enable a better interpretation". The coding, Easterby and Hakiel concluded, is read as colour combinations with shape added comparatively independently. 2
Which is why a safety-sign system spells each message out three times at once. A prohibition sign is round, red-edged and crossed, with the red taking at least 35% of its area; a warning sign is a triangle on a yellow ground covering at least half of it; a mandatory sign is a round blue field with a white pictogram. 6 Detail that keeps the object identifiable at the size it will be seen at is free. The simplification that costs you is the one that erases the feature a symbol is told apart by.
Exposure decides which test you owe
The measured variable with the largest effect sits outside the drawing. In Green and Pew's study, subjects who could name only 2.6 of the 19 symbols at the start cut their learning errors from 7.1 per person on the first day to 1.3 on the second, and to almost none after that. 2 Later work that controlled exposure found familiarity improving performance, with its advantage growing as the task became harder; the same review reports that users perform better with simple than with complex icons, and understand icons with closer semantic distance more easily. 7
Both findings describe different symbols, and exposure separates them. A symbol in an exit route or a hazard label gets no training: "Since no permit or license is required to use the built environment, no natural opportunity exists for training or testing," so its effectiveness depends on being understood the first time. 2 A toolbar icon is trained by use, because every use is a repetition. The properties that make a symbol learnable were rated for 239 symbols — concreteness, complexity, meaningfulness, familiarity and semantic distance — so that the argument could be measured instead of had. 8
The comprehension standard carries a hedge that belongs in the brief. ISO 9186-1 exists to test symbols "when no supplementary (i.e. explanatory) text is presented", and it adds that where such a symbol cannot be developed, "it might be necessary to present a graphical symbol together with supplementary text explaining its meaning in the language of the intended users". 9
A label is how a symbol survives its first encounters. Where the viewer meets it once, keep the label visible rather than behind hover, which costs an interaction and does not work on touch. 4 Where the viewer meets it daily, hold the label through the early uses and let the icon take over as familiarity arrives.
Run the test you owe
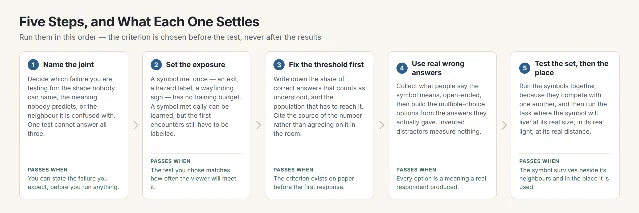
The first decision is which failure you are testing for, because one test cannot answer all three joints.
Recognition is tested out of context, early: show the shape on its own, with no label and no surrounding screen, and ask what it is. Interpretation is tested in context, once a mockup exists: show it in place and ask what the person expects it to do. 1
For the symbol programme, the sequence ran in four parts: open-ended meanings, then a four-choice question built from the wrong answers collected beforehand, then a matching test across the whole set, and finally a field task in which conventional signs were removed from a museum and subjects were timed to each destination, with further tests at an airport and a subway station. The paper tests maximised reliability, the field task ensured validity, and the two agreed. 2
| Discipline | Where the symbol is met | What fails there | The test that fits |
|---|---|---|---|
| Graphic design | A sign, a label, a printed instruction | The image is drawn once and sized for a viewing distance nobody checked | Show it at its real size, at its real distance, in its real light |
| UX/UI design | A toolbar, a navigation bar, an app screen | The shape is recognised while the action users predict is wrong 1 | In-context screenshot test: ask what it does, not what it depicts |
| Ergonomics | Equipment controls and warning labels | Small size, low light and reduced vision; where sight is impaired, the sign has to be supplemented or replaced 5 | Run the task at the real viewing distance with the real population |
| Industrial design | A control panel or a machine face | The symbol is confused with the one beside it 2 | Matching test across the whole panel at once |
The drawing is finished when someone who has never seen it gives the meaning you intended, in the place you will put it.
References
- 1
- 2
- 3Safety sign comprehension of fiberboard industry employees
pmc.ncbi.nlm.nih.gov
- 4Icon Usability
nngroup.com
- 5Council Directive 92/58/EEC on safety and/or health signs at work
eur-lex.europa.eu
- 6Safety signs
hse.gov.uk
- 7Icon Familiarity Affects the Performance of Complex Cognitive Tasks
pmc.ncbi.nlm.nih.gov
- 8Measuring symbol and icon characteristics: norms for 239 symbols
research.manchester.ac.uk
- 9
This story was produced automatically by a channel. One sentence is all it takes for Neodrop to keep producing for you.