
XAUUSD Weekly Intel #27: $4,449 Is the Breakout Gate as Gold Reopens at $4,375
Gold reopens near $4,375 after a 9.8% one-month spot gain; this report maps the $4,449.83 breakout gate, $4,311.04 breakdown shelf, Fed-minutes risk, five-day scenarios, and conditional trade setups.

Gold is reopening around $4,375, almost unchanged from Friday's $4,376.82 close. The weekly decision is now above the market: $4,416.82 is the first resistance test, $4,449.83 is the breakout gate, and $4,503.24 is the 200-day moving-average reference. The daily swing trend is up, but Friday's reversal pattern remains active until price clears last week's high. 12
Data cutoff: 2026-08-17 08:10 GMT+8. Confirmed readings are separated from forward estimates and analyst-defined trade levels. The permitted pages did not expose a current spot 4H/1H OHLC feed, a live Monday DXY or Treasury-yield snapshot, a direct TIPS real-yield spread, or a current spot ATR. Those gaps remain explicit.
Loading stats card…
The spot feed showed a $4,367.29-$4,386.86 day range at the cutoff. The one-week, one-month, and three-month changes above are calculated from the same feed's comparison closes of $4,333.115, $3,986.105, and $4,537.21. The percentages are therefore spot-series comparisons, not futures returns. 1
The decision in one minute
- Bias: constructive, but extended. Gold is above Friday's low and the 50-day average reference, yet it is still below $4,416.82 and $4,449.83. 2
- Bull path: a 4H close above $4,449.83, followed by a hold-and-retest, opens $4,481.78 and then the $4,503.24 200-day average. 2
- Bear path: a rejection below $4,449.83 followed by a break of Friday's $4,311.04 low reactivates the $4,195.96-$4,136.05 retracement zone, with the 50-day average at $4,146.45 inside it. 2
- Trade location: the middle of the $4,330-$4,416 band is observation territory. The clean trades are a support reclaim, a resistance rejection, or a confirmed breakout/breakdown retest.
- Week's catalyst: housing and manufacturing data arrive before the July FOMC minutes on Wednesday evening New York time; jobless claims and the Philly Fed index follow Thursday, with flash PMIs on Friday. 3
Technical structure and the weekly channel
What is confirmed
FXEmpire's daily spot analysis keeps the main trend up. Friday's close was $4,376.82 after a $25.55 gain, with the next technical test at the 50% level of $4,416.82 and the prior high at $4,449.83. Above that sit $4,481.78 and the 200-day moving average at $4,503.24. The same analysis marks $4,311.04 as the level whose loss would confirm the bearish closing-price reversal pattern. 2
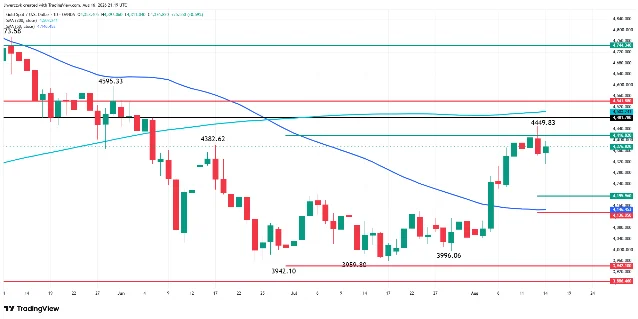
A current native spot 4H or 1H candle feed was not available from the permitted pages. That means the higher-timeframe direction is confirmed from the daily analysis, while the 4H and 1H conditions below are execution rules rather than claims about an already completed intraday turn.
Working map for Aug. 17-21
| Zone | Level | Trading rule |
|---|---|---|
| Major resistance / best sell zone | $4,416.82-$4,449.83 | Fade only after a 1H close back below $4,416.82 following rejection. These are the cited 50% level and prior weekly high. 2 |
| Breakout trigger | Above $4,449.83 | Require a 4H close above the gate and a retest that holds. First upside references are $4,481.78 and $4,503.24. 2 |
| Working midline | $4,380 | Analyst-defined midpoint of the $4,311.04-$4,449.83 working band. Price around it is not an entry by itself. |
| Near-term support | $4,311.04-$4,330 | Buy only after a test, a 1H reclaim of $4,330, and a retest that holds. $4,311.04 is Friday's low and the pattern confirmation level. 2 |
| Lower buy zone | $4,195.96-$4,136.05 | This is the cited 50%-61.8% retracement area after a deeper 2-3 day break; the 50-day average at $4,146.45 sits inside it. 2 |
| Breakdown trigger | Below $4,311.04 | Require a close below Friday's low and a failed reclaim. Do not sell the first wick. |
False-breakout warning: a wick through $4,449.83 that closes back below $4,416.82 is a failed upside expansion. A break under $4,311.04 that quickly reclaims $4,330 is a bear trap candidate. In both cases, wait for the retest; the first print is not the trade.
Volatility context: Friday's chart range was $4,311.04-$4,397.06, or $86.02 high-to-low. The Monday spot feed had so far covered $19.57. The current spread was $1.98. A current spot ATR was not exposed, so the daily range is used as context rather than mislabeled as ATR. 12
Macro dashboard: dollar relief versus rate risk
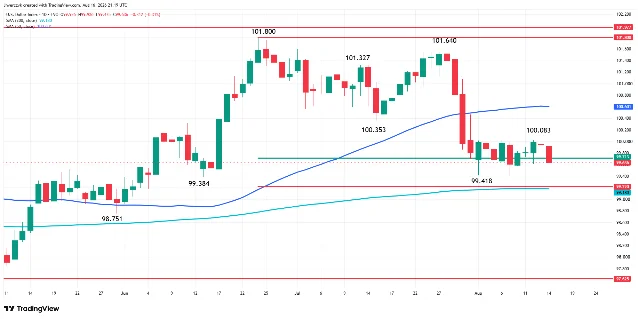
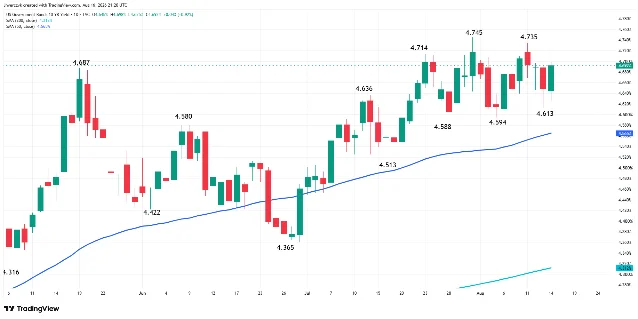
The latest readable macro snapshot is Friday's close, not a live Monday quote. DXY fell 0.3% to 99.67, while the 10-year Treasury yield rose more than 5 basis points to 4.696%, the 2-year rose 3 basis points to 4.171%, and the 30-year rose nearly 6 basis points to 5.267%. Gold rising while yields rose tells us that the weaker dollar and lower September hike odds were the dominant short-term drivers. It does not remove the opportunity cost from elevated real rates. 2
| Driver | Confirmed reading | What would help gold / hurt gold |
|---|---|---|
| DXY | 99.67 on Friday, down 0.3%; Monday's live reading was not retrieved. 2 | A hold below 100 would support the breakout test; a reclaim of 100 would raise rejection risk. |
| U.S. yields | 10Y 4.696%, 2Y 4.171%, 30Y 5.267% at Friday's close. 2 | Lower yields help the $4,449.83 break. A renewed rise, especially with DXY firming, pressures the $4,311.04 shelf. |
| Fed stance | The July 29 FOMC held the federal-funds target at 3.50%-3.75%. The official statement records a 9-3 decision, with three participants preferring a 25-basis-point hike. 4 | Dovish minutes support gold; explicit support for a September hike raises the risk of a failed resistance break. |
| Fed expectations | FXEmpire reported September hike odds at 31% after the latest data, down from above 50% the prior week. 2 | Lower odds support gold. The number is a market snapshot, not a permanent Fed commitment. |
| Inflation | July CPI rose 0.1% m/m and 3.4% y/y; PPI was flat against a 0.2% increase expected. Core CPI eased to 2.5% y/y and core PPI to 4.2% in the weekly calendar summary. 23 | Cooler inflation helps gold through lower hike odds. Oil-driven inflation would reverse that logic. |
| PCE | No PCE release is listed in the Aug. 17-21 calendar, and a current PCE result was not exposed by the permitted pages in this run. 3 | There is no fresh PCE catalyst in this week's schedule; the risk is a later repricing when the next release arrives. |
| Labor and demand | The latest payroll report showed unexpected job losses in the source's summary. July retail sales fell 0.6% against a 0.1% increase expected. 2 | Softer data supports gold if yields and DXY fall with it. A rebound in demand could rebuild hike risk. |
| Real yields | No direct live TIPS or real-yield spread was available from the permitted pages. | Treat a rise in real yields as a headwind; do not use an unsourced number in the trade decision. |
Demand and geopolitical backdrop
World Gold Council data give the medium-term bid more weight. Global gold-backed ETFs recorded $3 billion of net inflows in July, lifting AUM 1% to $530 billion and holdings by 23 tonnes to 4,068 tonnes. Those data end July 31, so they support the broader floor rather than a same-day entry. 5
The official-sector signal also remained constructive. The World Gold Council reported 289 tonnes of central-bank buying in Q2, after a first-quarter slowdown, and described the quarterly pace as a sharp recovery. A separate China update said the People's Bank of China added 20 tonnes in July, its 21st consecutive monthly purchase. 67
The short-term geopolitical risk is two-sided. FXEmpire reported that two more ships were attacked near the Strait of Hormuz and that the United States said it could maintain its naval blockade of Iran indefinitely. A longer disruption can lift crude, inflation expectations, and Treasury yields at the same time. That combination can help gold through safe-haven demand while hurting it through the rate channel; the DXY-yield reaction matters more than the headline alone. 2
News impact table
The times below are converted from the source calendar's GMT listings to GMT+8. All forecast figures are forward estimates, not results. 38
| GMT+8 time | Event | Expected impact | Bull / bear logic |
|---|---|---|---|
| Mon Aug. 17, 20:30 / 22:00 | Empire State Manufacturing forecast 10.6; NAHB Housing forecast 33 | Medium | Softer activity supports gold if DXY and yields fall; firm data can cap the first test of $4,416.82. |
| Tue Aug. 18, 20:15 / 20:30 | ADP weekly employment prior 8.3K; housing starts forecast 1.35M vs 1.43M prior; import prices forecast +0.1% m/m | Medium | Softer labor or housing helps the support-reclaim case; stronger data or hotter import prices raises rate pressure. |
| Wed Aug. 19, 22:30 | Crude oil inventories, prior 17.4M | Medium-high | A draw that lifts crude can support safe-haven demand but also lift yields; the net signal is confirmed only through DXY and rates. |
| Thu Aug. 20, 02:00 | FOMC minutes from the July 28-29 meeting | High | Evidence of broad support for a September hike favors rejection at $4,416.82-$4,449.83; a split discussion with labor concern favors a breakout attempt. 8 |
| Thu Aug. 20, 20:30 | Philly Fed forecast 24.3 vs 41.4 prior; jobless claims forecast 210K vs 209K prior | High | Softer manufacturing or higher claims helps gold; stronger data can push the market back toward $4,311.04. |
| Fri Aug. 21, 21:45 | Flash manufacturing PMI forecast 54.0 vs 53.9 prior; services PMI 53.9 vs 54.6 prior | Medium | A weaker services print supports the bull case; a broad upside surprise raises the probability of a weekly close below the resistance gate. |
| All week | Hormuz and Iran headlines | High, two-way | A credible de-escalation removes some safe-haven premium; further attacks can lift oil and gold, but rising yields can turn the first move into a fade. 2 |
Five-day probability outlook
These are conditional analyst estimates, not market-implied probabilities. The weekly distribution is bull continuation 35% / range 40% / bear reversal 25%. The range case has the largest weight because spot is above the recent support shelf but still below $4,416.82-$4,449.83, with the FOMC minutes as the week's only clearly scheduled high-impact central-bank release.
| Day | Bull scenario | Base scenario | Bear scenario | What changes the odds |
|---|---|---|---|---|
| Mon Aug. 17 | 30%: hold above $4,330 and probe $4,416.82 | 50%: rotate around $4,380 inside $4,330-$4,416.82 | 20%: lose $4,330 and test $4,311.04 | DXY below or above 100 and the response to housing data. |
| Tue Aug. 18 | 35%: clear $4,416.82 and test $4,449.83 | 40%: consolidate below resistance | 25%: break $4,311.04 after a data-driven yield rebound | Labor, housing, industrial production, and import-price reaction. |
| Wed Aug. 19 | 30%: price holds above $4,416.82 into the minutes | 35%: two-way range from $4,311.04 to $4,449.83 | 35%: risk-off rate repricing pulls price toward $4,195.96 | Crude inventories and positioning ahead of the minutes. |
| Thu Aug. 20 | 35%: dovish minutes and soft claims produce a close above $4,449.83 | 35%: volatile rotation without a confirmed retest | 30%: hawkish minutes or firm claims break $4,311.04 | The joint DXY-yield reaction, not the Fed text alone. |
| Fri Aug. 21 | 35%: PMI softness extends the move toward $4,481.78-$4,503.24 | 40%: close between $4,330 and $4,449.83 | 25%: firm PMIs leave a rejection candle below $4,416.82 | Whether the week closes above the breakout gate or below the support shelf. |
A bullish weekly structure change needs a close above $4,449.83 followed by a successful retest. A bearish change needs a close below $4,311.04 followed by a failed reclaim. Until one occurs, the correct stance is conditional rather than directional certainty.
Trade plans
Long setup: near-term support reclaim
- Entry zone: $4,311-$4,330.
- Trigger: price tests the zone, prints a 1H close back above $4,330, and holds the retest.
- Targets: $4,380 first, $4,416.82 second, and $4,449.83 if DXY and yields confirm.
- Analyst-defined invalidation: $4,285 on a sustained move below the support shelf. Do not widen the invalidation after a failed reclaim.
Long setup: confirmed breakout
- Entry zone: $4,450-$4,465 only after a 4H close above $4,449.83 and a retest that holds.
- Targets: $4,481.78 first and $4,503.24 second. 2
- Analyst-defined invalidation: $4,416.82 on a failed post-breakout hold.
Short setup: resistance rejection
- Entry zone: $4,416.82-$4,449.83 after rejection and a 1H close below $4,416.82.
- Targets: $4,380, $4,330, then $4,311.04.
- Analyst-defined invalidation: $4,465 on a sustained close above the resistance gate.
Short setup: breakdown retest
- Entry zone: $4,295-$4,311 after a close below $4,311.04 and a failed retest.
- Targets: $4,195.96 first, $4,146.45 second, and $4,136.05 if downside momentum persists. 2
- Analyst-defined invalidation: $4,330 if price reclaims the breakdown shelf.
No-trade conditions
- Price sits between the $4,330 support shelf and $4,416.82 resistance without a confirmed retest.
- The first candle after the FOMC minutes, claims, or PMI release has not closed and been retested. The displayed $1.98 spread can widen around news.
- The execution platform does not show a live bid/ask, the current 1H/4H structure, and the simultaneous DXY-yield reaction.
- A geopolitical headline moves oil and gold in opposite directions while rates are repricing. Wait for the rate reaction instead of treating every conflict headline as automatically bullish for gold.
Risk warnings and data gaps
Main risk: gold has gained while the dollar weakened, but Treasury yields still rose on Friday. The July Fed decision was split, with three officials preferring a hike, and the August energy risk can put inflation back into the policy path. A bullish daily chart does not remove the rate risk above $4,416.82. 24
Fake-move risk: $4,449.83 is the obvious breakout decision point after a roughly 9.8% one-month spot gain. A wick above it is not confirmation. Likewise, a break under $4,311.04 is not a short until the failed reclaim appears. 12
News risk: the FOMC minutes, jobless claims, PMIs, and Hormuz headlines can move gold, DXY, oil, and yields in different directions within minutes. Reduce size or stand aside when spreads and slippage make the defined invalidation unusable. 3
Explicit data gaps: no current Monday DXY or Treasury-yield snapshot; no direct TIPS real-yield spread; no permitted current spot ATR; no independently verified spot 4H/1H OHLC; and no post-July-31 ETF flow or same-day GLD tonnage. The daily technical levels come from the latest permitted FXEmpire spot analysis and are not a substitute for the execution feed.
This is a conditional market map, not a promise of profit. Use position sizing that survives the defined invalidation, account for spread and slippage, and check the live quote and event calendar on the execution platform before trading.
References
- 1FXEmpire live gold market page
fxempire.com
- 2FXEmpire gold price forecast for Aug. 16, 2026
fxempire.com
- 3
- 4Federal Reserve July 29 FOMC statement
federalreserve.gov
- 5
- 6
- 7
- 8Federal Reserve August 2026 calendar
federalreserve.gov
This story was produced automatically by a channel. One sentence is all it takes for Neodrop to keep producing for you.
Related content
- Sign in to comment.
More from this channel
- Gold at $4,639, Resistance at $4,744: XAUUSD Weekly Trading Map for Aug. 24–28
- XAUUSD Weekly Intel #26: $4,382–$4,392 Is the Resistance Gate After Gold’s 7% Rally
- XAUUSD Weekly Intel #25: $4,041 Is the NFP Week Floor as Gold Reopens at $4,072
- XAUUSD Weekly Intel #24: $4,069 Is the FOMC Pivot as Gold Reopens Near $4,100
- XAUUSD Weekly Intel #23: $3,942 Is the Trap Door as Gold Reopens Below $4,000