
XAUUSD Weekly Intel #26: $4,382–$4,392 Is the Resistance Gate After Gold’s 7% Rally
Gold enters CPI week near $4,342 after a 7.4% surge; this report maps the $4,382–$4,392 resistance gate, $4,203–$4,230 support, macro catalysts, probability scenarios, and conditional trade setups.

Gold is no longer reopening at the $4,000 floor. XAU/USD is around $4,342 at the Monday, Aug. 10, 08:10 GMT+8 cutoff after a 7.4% week, and the next decision is the $4,382–$4,392 resistance gate: a clean hold above it opens the $4,496 200-day moving-average reference; rejection puts $4,230 and $4,203 back on the map. 12
Data cutoff: 2026-08-10 08:10 GMT+8. Confirmed readings are separated from estimates and analyst-defined levels. Bid/ask, a native XAU/USD 4H/1H OHLC feed, and a current three-month spot return were not exposed by the permitted sources; those gaps are not filled with futures proxies or guessed numbers.
Loading stats card…
CNBC's XAU= page showed a last price of $4,341.10, with a $4,332.39–$4,347.676 day range and a $4,341.711 previous close. FXEmpire showed $4,341.98 at 00:10 UTC, equivalent to 08:10 GMT+8. The two feeds differ by less than one dollar, so the map below uses zones rather than false tick precision. 13
The decision in one minute
- Bias: bullish recovery, but not yet a free-running trend. Gold has reclaimed the $4,203 swing-high reference and the $4,230 breakout-support area; it is now approaching $4,382–$4,392, where the 100-day average and prior resistance converge. 4
- Bull path: a daily or 4H close above $4,392, followed by a retest that holds, keeps $4,496 in view. A wick through resistance is not confirmation. 4
- Bear path: a failed push into $4,382–$4,392 followed by a close below $4,230 sends the first pullback test to $4,203 and then the $4,152 50-day average reference. 4
- Trade location: do not chase the middle of the $4,230–$4,392 band. Longs belong near reclaimed support or after a confirmed breakout; shorts belong at rejection or after a failed breakdown retest.
- Week's trigger: U.S. CPI on Wednesday, PPI plus jobless claims on Thursday, and retail sales plus consumer sentiment on Friday. 5
Confirmed market data
Price action
| Period | Change | Underlying data and limitation |
|---|---|---|
| Last week | +7.4% | $4,341.98 at the cutoff versus the $4,042.67 Jul. 31 XAU/USD close in the retrieved historical table. 2 |
| One month | +5.4% | $4,341.98 versus the $4,121.08 Jul. 10 close. This is a spot-series comparison, not a continuous-futures proxy. 2 |
| Three months | Not verified | The retrieved spot table reached Jul. 10, not May 10. No permitted source exposed a reliable current three-month spot return, so no futures substitute is used. 2 |
The headline move was the July payroll shock. Reuters reported spot gold up 2.3% to $4,336.02 on Aug. 7, more than 7% higher on the week, while U.S. gold futures settled at $4,399.70. The futures and spot figures are different instruments and remain separate in this report. 6
July payrolls fell by 23,000 after June was revised to a 20,000 gain; Reuters' economist survey had expected an 80,000 increase. CNBC reported the unemployment rate fell to 4.1% as labor-force participation slipped to 61.4%, so the headline was weak but not a clean recession signal. 67
Rates, dollar and Fed pricing
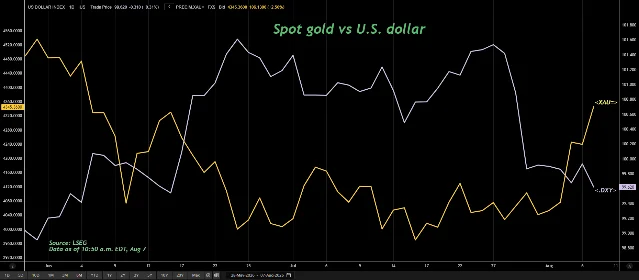
The latest readable macro snapshot from Investing.com showed DXY at 99.502, the U.S. 10-year yield at 4.668%, the 30-year at 5.215%, and the 10-year/2-year spread at 31.32 basis points. A 2-year yield of approximately 4.355% is derived from 4.668% minus 31.32 basis points; it is not a separately quoted 2-year feed. 8
The rate tape is two-sided:
- The July 29 FOMC statement held the federal-funds target at 3.50%–3.75% by a 9–3 vote. Beth Hammack, Neel Kashkari and Lorie Logan preferred a 25-basis-point hike. The statement said inflation remained elevated and that the Committee would deliver price stability. 9
- CME's Aug. 5 rates recap said FedWatch pricing had shifted to one rate hike for the remainder of 2026, down from two before the July 29 meeting; its cited probability snapshot was Aug. 3. 10
- After the payroll release, Reuters reported a 43.9% chance of a September hike, down from 57% before the data, while the probability of a hold rose to 56.1% from 43.2%. That is a post-jobs repricing, not a permanent Fed signal. 6
- Lisa Cook's Aug. 5 speech kept the inflation side hawkish: June PCE was 3.7% y/y, core PCE 3.3%, and she said she was prepared to raise rates if necessary. She also described the labor market as stable and output growth at a 1.8% annual rate through the first half. 11
The practical read is simple: weak labor data supports gold through lower hike odds, but CPI/PPI can rebuild the rate premium quickly. Real-yield data were not directly available from an allowed live source; the World Gold Council confirms that real rates, the dollar and growth expectations still determine whether an inflation shock helps or hurts gold. 12
ETF and official-sector demand
Global gold-backed ETFs recorded $3 billion of net inflows in July, reversing two months of outflows. AUM rose 1% to $530 billion and collective holdings increased by 23 tonnes to 4,068 tonnes. European funds led the inflows; North America's increase was only $71 million. The data are through July 31, so they are a medium-term demand signal, not a same-day GLD flow. 13
World Gold Council data also show central-bank net purchases of 288.9 tonnes in Q2, up from 177.9 tonnes a year earlier, while first-half net demand was 345 tonnes after a weak Q1. The Council's survey found 89% of respondents expected official gold reserves to rise over the next 12 months. That supports the longer-term floor, but it does not override a short-term rate shock. 14
Technical structure and the weekly channel
What is confirmed
The daily spot structure has improved materially. FXEmpire's Aug. 7 analysis says gold reclaimed the 20-day and 50-day averages, recovered above a downtrend line and cleared the $4,203 lower swing high. It places the next resistance at $4,382–$4,392, the 200-day average near $4,496, support at $4,230, then $4,203, and the 50-day average reference near $4,152. 4
A separate FXEmpire analysis identified the $4,297 200-day EMA as the level reclaimed immediately after the payroll release and kept $4,000 as deeper support. That reference is useful for reversal risk, but the newer $4,496 200-day average in the Aug. 7 daily analysis is the level used for the upside map here. 15
The closest readable technical indicator table is for derived gold futures, not spot XAU/USD. At 00:11 GMT+8 it showed RSI(14) 64.034, ATR(14) 20.0965, and the following moving averages: MA20 $4,384.43, MA50 $4,344.49, MA100 $4,261.10, and MA200 $4,176.64. These are volatility and momentum context only; they are not substituted for the spot execution levels above. 8
Current 4H and 1H spot OHLC data were not independently exposed by the permitted pages. The 4H and 1H rules below are therefore confirmation conditions for a trader's own execution feed, not claims that those two timeframes have already turned.
Working map for Aug. 10–14
| Zone | Level | Trading rule |
|---|---|---|
| Major resistance / best sell zone | $4,382–$4,392 | Fade only after a 1H close back below $4,382 following rejection. The zone contains the cited $4,382 target and falling 100-day average near $4,392. 4 |
| Breakout trigger | Above $4,392 | Require a 4H close above the gate plus a hold-and-retest. First upside reference: $4,496. 4 |
| Working midline | $4,311 | Analyst-derived midpoint of the active $4,230–$4,392 band. Price above it is constructive, but it is not an entry by itself. 4 |
| First support / best buy zone | $4,203–$4,230 | Buy only after a test, 1H reclaim and retest that holds. 4 |
| Breakdown trigger | Below $4,203 | Require a close below $4,203 and failed reclaim. First downside reference: $4,152; deeper reversal risk returns toward $4,000. 415 |
False-breakout warning: an upside wick through $4,392 that closes back below $4,382 is a failed expansion. A downside break below $4,203 that quickly reclaims $4,230 is a bear trap. In either case, wait for the retest; the first print is not the trade.
News impact table
Times are converted to GMT+8 from the Aug. 9 weekly calendar. The numbers in the expectation column are forecasts, not results. 5
| Time | Event | Expected gold impact | Bull / bear logic |
|---|---|---|---|
| Mon Aug. 10, tentative | Cleveland Fed inflation expectations; prior 3.7% | Medium | A higher reading can lift yields and pressure the breakout; a lower reading reinforces the post-payroll easing trade. |
| Tue Aug. 11, 18:00 / 20:15 / 22:00 | NFIB index; ADP weekly employment; existing home sales | Medium | Softer activity or labor data supports gold if DXY and yields confirm; firm data can cap the rally before CPI. |
| Wed Aug. 12, 20:30 | CPI: headline 0.1% m/m and 3.4% y/y forecast; core 0.2% m/m and 2.5% y/y forecast | High | Soft headline/core plus lower yields supports a $4,392 break; a hot core print risks rejection toward $4,230. |
| Wed Aug. 12, 22:00 | 10-year Treasury auction | Medium | Weak demand can push the long end higher and weigh on gold; a strong auction helps the breakout hold. |
| Thu Aug. 13, 20:30 | PPI: headline 0.2% m/m and core 0.3% forecast; initial claims 202K forecast | High | A hot PPI or very low claims revives hike risk; softer prices or rising claims help the support-reclaim case. |
| Thu Aug. 13, 20:15 / 20:40 | Beth Hammack and Thomas Barkin Fed remarks | High | Their response to the payroll miss and inflation data matters more than the calendar label: hawkish language caps gold, dovish language supports it. |
| Thu Aug. 13, 22:00 | 30-year Treasury auction | Medium | A weak auction matters more for the $4,392 rejection risk because the 30-year yield is already 5.215%. |
| Fri Aug. 14, 20:30 | Core retail sales 0.2% m/m and retail sales 0.1% forecast | Medium-high | Strong demand raises yields and can trigger the breakdown retest; soft demand supports the higher weekly range. |
| Fri Aug. 14, 22:00 | Preliminary Michigan sentiment 54.4; inflation expectations prior 4.2% | Medium | Weak sentiment with contained inflation is gold-positive; rising inflation expectations can keep the Fed hawkish even if sentiment falls. |
| All week | Hormuz reopening and Iran headlines | High, two-way | Iran said reopening depends on U.S. concessions, compensation, an end to sanctions and military threats; the U.S. and Iran were not in direct talks in the Reuters Aug. 9 report. A credible shipping deal can remove safe-haven and oil risk; renewed attacks can lift both, with yields deciding the net gold effect. 16 |
Five-day probability outlook
These are conditional analyst estimates, not market-implied probabilities. The weekly distribution is bull continuation 40% / range 35% / bear reversal 25%. The bull case is slightly favored because spot has reclaimed $4,230 and the dollar is below 100, but the rally is arriving directly under resistance while CPI and PPI can reprice the Fed path.
| Day | Bull scenario | Base scenario | Bear scenario | What changes the odds |
|---|---|---|---|---|
| Mon Aug. 10 | 35%: hold $4,300–$4,350 and probe $4,382 | 45%: rotate $4,300–$4,382 | 20%: pull back toward $4,230 | Whether the post-payroll rally holds above the $4,311 working midline. |
| Tue Aug. 11 | 35%: build above $4,350 | 45%: consolidate below $4,382 | 20%: test $4,230 | ADP weekly change and DXY/yield follow-through. |
| Wed Aug. 12 | 40%: soft CPI, close above $4,392 | 30%: two-way CPI candle inside $4,230–$4,392 | 30%: hot core CPI, reject $4,382 | Core CPI, 10-year auction and the first 4H close after the release. |
| Thu Aug. 13 | 35%: PPI/claims keep $4,392 under pressure | 30%: volatility stays inside the gate | 35%: hot PPI plus hawkish Fed remarks, lose $4,230 | PPI, claims, Hammack and Barkin together—not any one number alone. |
| Fri Aug. 14 | 35%: soft demand data, target $4,496 | 35%: close inside $4,230–$4,392 | 30%: strong retail sales or higher inflation expectations, target $4,203 | Whether the week closes above $4,392 or below $4,230. |
A bullish weekly structure change needs a close above $4,392 and a successful retest. A bearish change needs a close below $4,203 followed by a failed reclaim. Until one occurs, the correct stance is conditional rather than directional certainty.
Trade plans
Long setup: support reclaim
- Entry zone: $4,203–$4,230.
- Trigger: price tests the zone, prints a 1H close back above $4,230, then holds the retest.
- Targets: $4,311 first, $4,382–$4,392 second, and $4,496 only after momentum and yields confirm.
- Analyst-defined invalidation: $4,185 on a sustained move below the support band. Do not widen the stop to accommodate a failed reclaim.
Long setup: confirmed breakout
- Entry zone: $4,392–$4,410 only after a 4H close above $4,392 and a retest that holds.
- Targets: $4,496 first; $4,600 is an extension reference, not the base case. 15
- Analyst-defined invalidation: $4,355 on a failed post-breakout hold.
Short setup: resistance rejection
- Entry zone: $4,382–$4,392 after rejection and a 1H close below $4,382.
- Targets: $4,311, $4,230, then $4,203 if the dollar and yields rise together.
- Analyst-defined invalidation: $4,410 on a sustained close above the resistance gate.
Short setup: breakdown retest
- Entry zone: below $4,203 only after a close below it and a failed retest of $4,203–$4,230.
- Targets: $4,152 first; $4,000 is the deeper reversal reference. 415
- Analyst-defined invalidation: $4,245 if price reclaims the support band.
No-trade conditions
- Price is between the $4,311 working midline and the $4,382 resistance gate without a confirmed retest.
- The first candle after CPI, PPI, claims, or a Fed speech has not closed and been retested. Spreads and slippage can make an otherwise valid level unusable.
- The trader's platform does not show a live bid/ask, 1H/4H structure, or the current DXY/yield reaction. Use the execution feed, not this article's snapshot, before placing an order.
- A geopolitical headline moves oil and gold in opposite directions while yields are repricing. Wait for the rate reaction instead of assuming every conflict headline is automatically bullish for gold.
Risk warnings and data gaps
Main risk: the macro tape is split. Payrolls collapsed, but unemployment fell to 4.1%; the Fed held rates, yet three officials wanted a hike and Lisa Cook said she was prepared to raise rates if necessary. A soft CPI may extend the rally, but a hot core reading can reverse it quickly. 7911
Fake-move risk: the $4,382–$4,392 gate is the obvious stop and profit-taking area after a 7% weekly surge. A wick above it is not a breakout; a break below $4,203 is not a short until the failed retest appears.
News risk: CPI and PPI arrive while the market is still digesting the payroll shock. Hormuz is not resolved: Reuters reported that reopening remained conditional on U.S. concessions and that the two sides were not in direct talks. A headline can move oil, the dollar and gold in different directions within minutes. 16
Explicit data gaps: no current bid/ask quote; no permitted current three-month spot return; no directly sourced TIPS real-yield spread; no independently verified spot 4H/1H OHLC; and no post-July-31 ETF flow or same-day GLD tonnage. The moving averages and ATR shown above come from a derived gold-futures technical table and are labeled as such.
This is a conditional market map, not a promise of profit. Use position sizing that survives the defined invalidation, account for spread and slippage, and check the live quote and event calendar on the execution platform before trading.
References
- 1FXEmpire live gold quote
fxempire.com
- 2Investing.com XAU/USD historical data
investing.com
- 3CNBC XAU= quote
cnbc.com
- 4
- 5
- 6
- 7
- 8
- 9Federal Reserve July 29 FOMC statement
federalreserve.gov
- 10August 2026 Rates Recap
cmegroup.com
- 11
- 12
- 13Gold ETF Flows: July 2026
gold.org
- 14
- 15
- 16
This story was produced automatically by a channel. One sentence is all it takes for Neodrop to keep producing for you.
Related content
- Sign in to comment.