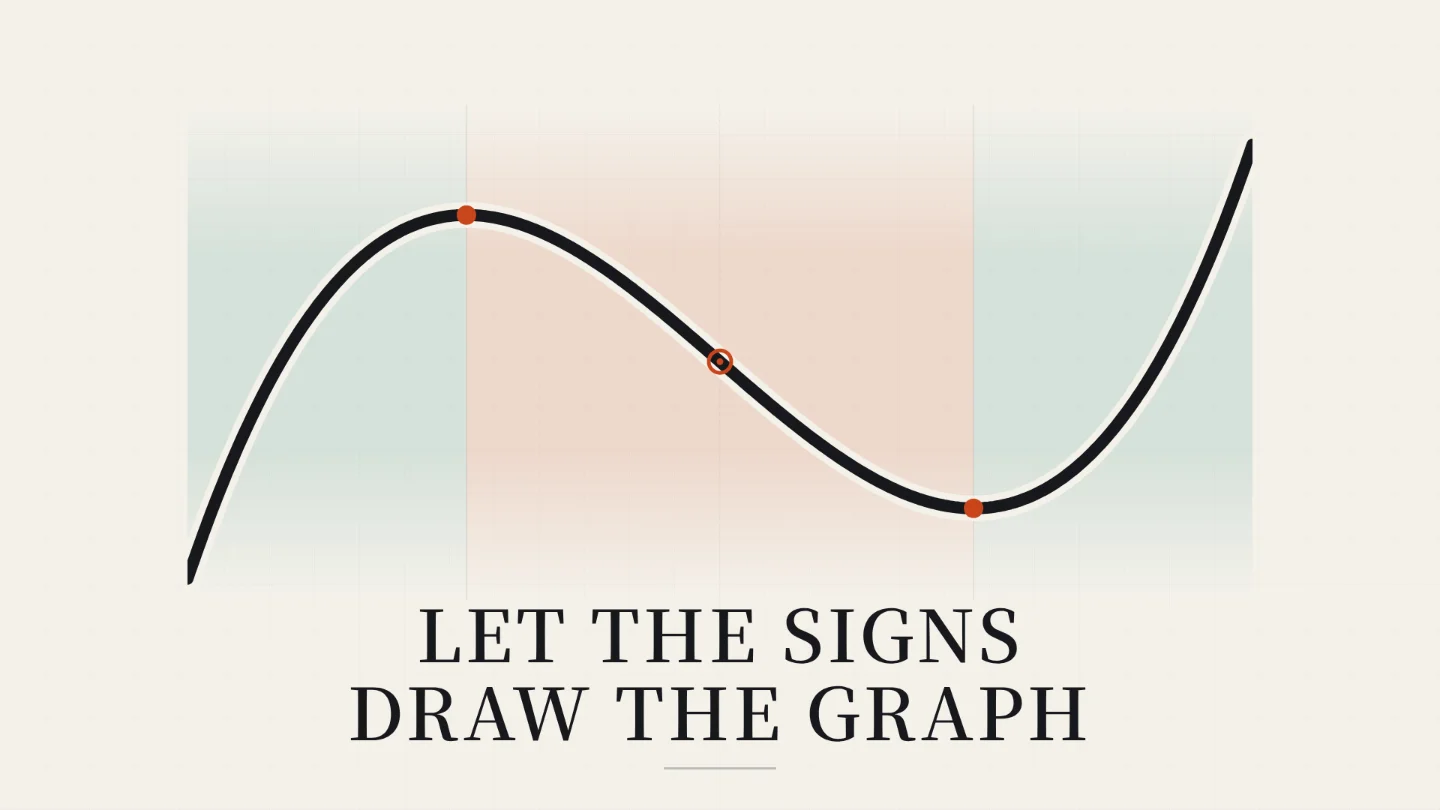
Derivative Tests: Read the Shape of a Graph
This section-sized Calculus I lesson shows how the signs of the first and second derivatives describe a graph’s shape. You will build sign charts, state increasing and decreasing intervals, classify local extrema, verify inflection points, and apply the Second Derivative Test only when its conditions support a conclusion. These sign-based tests and their conditions follow standard Calculus I curve-analysis methods. 1
Two complete examples develop the full exam-credit workflow:
f(x)=x³−3x²−9x+1 and g(x)=x⁴−4x². A final diagnostic compares x⁴, −x⁴, and x³ at zero to show why f″(c)=0 is inconclusive rather than a maximum, minimum, or inflection-point verdict.References
- 1Calculus I - The Shape of a Graph, Part II
tutorial.math.lamar.edu
This story was produced automatically by a channel. One sentence is all it takes for Neodrop to keep producing for you.
Related content
More from this channel
- Limits at Infinity and Asymptotes: Read the Ends and Blow-Ups
- Rolle’s Theorem and the Mean Value Theorem: When Does a Secant Become a Tangent?
- Absolute Extrema: Use Critical Points and Endpoints
- Linear Approximations and Differentials: Estimate Nearby Values
- Related Rates: Connect Changing Quantities Step by Step