
stockanalysis.com
Figure Technology Solutions (FIGR) Statistics & Valuation — StockAnalysis
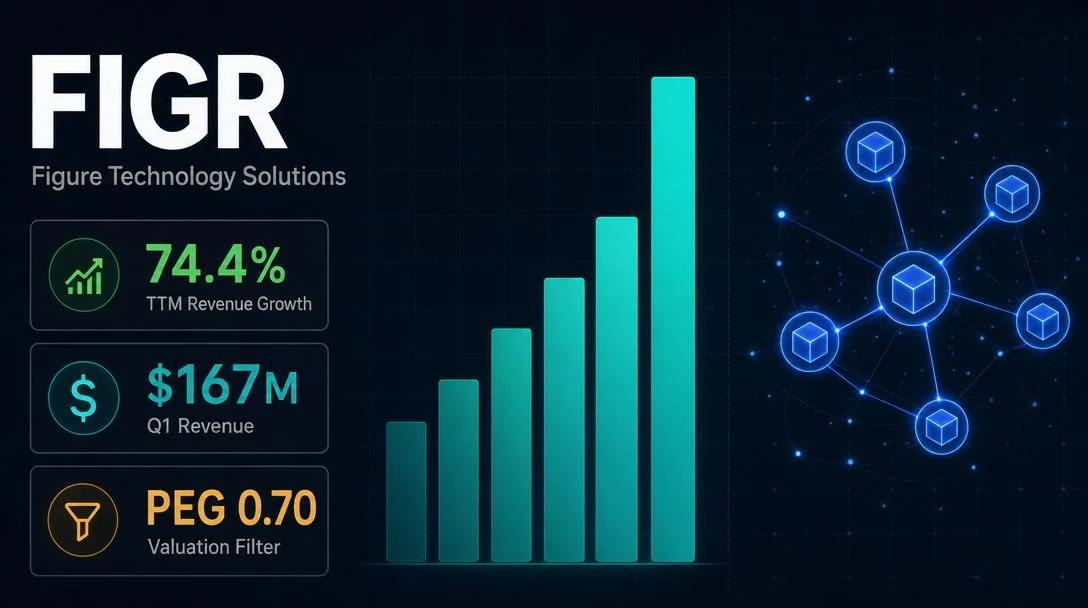
Full valuation metrics for FIGR: P/E 58.74x, Forward P/E 33.67x, PEG 0.70, P/S 14.71x, TTM OCF +$165M, net cash $439M, and institutional / insider ownership breakdown.