Costco (NASDAQ: COST) — what a 27% ROE looks like when the gross margin is only 13%

Costco (NASDAQ: COST) — what a 27% ROE looks like when the gross margin is only 13%

Costco passes all three hard screening criteria — FY2023–FY2025 ROE of 25.1%/31.2%/27.8% (SEC EDGAR verified), consistently positive FCF ($7.84B in FY2025, 1.72% yield), and a trailing P/E of 53.5x that is premium but historically consistent for the business. The article covers the DuPont paradox behind a 2.9% margin producing 28% ROE, the membership-fee profit model, full peer valuation table vs. WMT/BJ/TGT/DG/KR, balance sheet health (D/E 0.20, interest coverage 67x), insider selling pattern, and the May 28 Q3 FY2026 earnings as the immediate catalyst.

US Stock Pick: 3-Year ROE > 15%
2026. 5. 26. · 21:30
구독 1개 · 콘텐츠 9개
Current price: $1,028.24 (May 22, 2026, last trading day before Memorial Day; markets reopen May 27) · Market cap: ~$456B · Sector: Consumer Staples / Retail
Costco's financials look wrong at first glance. Gross margins of about 13% sit far below Walmart's 23% or Target's 26%. Operating margins barely reach 3.8%. Yet the company has compounded net income at 10% annually for five years, generated $7.8 billion in free cash flow in FY2025 alone, and has maintained return on equity above 25% in every fiscal year since at least FY2021. Earning a 27% ROE from a business that marks up groceries by 13% requires a business model that is structurally different from conventional retail — and that difference is worth understanding before looking at the valuation.1

What Costco actually sells

Costco Wholesale Corporation (founded 1983, headquartered in Issaquah, Washington) operates membership-only warehouse clubs. Shoppers pay an annual fee for the right to buy merchandise — and Costco's goal is to offer the lowest possible price on every item in its curated, narrow selection (Costco reportedly carries roughly 3,700–4,000 SKUs, compared to a typical supermarket's 30,000+).2
The model has two interlocking pieces. On the merchandise side, Costco keeps margins intentionally thin — the company has a well-documented internal policy capping markups on most items (industry analysts place the ceiling around 14%), and the average reportedly sits closer to 11%. This makes it structurally difficult for a normal retailer to match Costco's shelf price on the same SKU. On the revenue side, the company earns its profit primarily from membership fees, not from product sales. The Gold Star membership is currently $65 per year; the fee stream flows almost entirely to operating income because the incremental cost of serving existing members is low.
The membership fee is what enables the razor-thin merchandise pricing. It also gives Costco an unusually predictable revenue base: Costco has historically reported North American membership renewal rates in the low 90s percent range, meaning the fee income is resilient to short-term fluctuations in merchandise volumes.1
The Kirkland Signature private-label line amplifies this model — it is widely estimated to account for roughly 25–30% of total sales. Kirkland items carry slightly higher margins than national-brand equivalents while still undercutting comparable branded products at retail. Costco earns an extra margin point while reinforcing the value narrative.

ROE track record — SEC EDGAR verified

All figures from SEC EDGAR XBRL 10-K annual filings (CIK 0000909832).1 ROE calculated as year-end net income divided by year-end stockholders' equity.
Fiscal yearNet incomeStockholders' equityROE
FY2023 (ended Sep 3, 2023)$6.29B$25.06B25.1%
FY2024 (ended Sep 1, 2024)$7.37B$23.62B31.2%
FY2025 (ended Aug 31, 2025)$8.10B$29.16B27.8%
All three years clear the 15% hard threshold. The FY2024 spike to 31.2% reflects equity contracting by $1.44 billion — partly the result of a $15-per-share special dividend paid in January 2024, which reduced retained equity while net income kept growing. FY2025 equity rebounded to $29.16B as earnings accumulated again, and ROE settled at 27.8%. The five-year average (FY2021 through FY2025) is approximately 28%, with the annual figures ranging from 25.1% to 31.2% — consistent for a company with a 2.9% net margin.1
How does a 2.9% net margin produce a 28% ROE? High asset turnover. Costco rotates inventory quickly and collects cash from members before it has to pay suppliers — meaning the asset base supporting those earnings is lean relative to the revenue it generates.

Free cash flow

차트를 불러오는 중…
FCF (operating cash flow minus capital expenditures) from SEC EDGAR:1
  • FY2023: $11.07B OCF − $4.32B capex = $6.75B
  • FY2024: $11.34B OCF − $4.71B capex = $6.63B
  • FY2025: $13.34B OCF − $5.50B capex = $7.84B
The FY2022 dip to $3.50B was driven by an OCF decline — likely inventory build during the peak inflation period — rather than any structural change. FCF has grown in every year since. Capital expenditure has risen steadily ($3.59B in FY2021 to $5.50B in FY2025), reflecting an ongoing warehouse expansion program rather than maintenance spending.
FCF yield at the current ~$456B market cap: $7.84B / $456B = 1.72%. That is below the 10-year Treasury rate, confirming that COST is priced for growth, not for yield.

Revenue, earnings, and margins

차트를 불러오는 중…
Revenue grew from $195.9B in FY2021 to $275.2B in FY2025 — a 5-year CAGR of 8.9%.1 Net income CAGR over the same period was 10.1% — earnings growing slightly faster than revenue, reflecting modest but real operating leverage.
The FY2025 membership fee increase (Gold Star from $60 to $65, Executive from $120 to $130, effective September 1, 2024 — the first increase since June 2017) contributed to the FY2025 revenue step-up and margin expansion. Operating margin moved from 3.3% in FY2023 to 3.8% in FY2025, while net margin held at 2.9% for FY2024 and FY2025 (up from 2.6% in FY2021–2023).1
H1 FY2026 (the 26 weeks ending February 15, 2026) continued the pattern: revenue of $136.9B (+8.9% year-over-year) and net income of $4.04B (+12.5% year-over-year), suggesting the TTM run rate is approximately $286B in revenue and $8.55B in net income.1
Diluted EPS reached $18.21 in FY2025 (from $11.27 in FY2021). Shares outstanding have been virtually flat — approximately 444 million diluted shares across all five years — because Costco does minimal buybacks and instead returns cash through dividends.

Valuation

통계 카드를 불러오는 중…
At 53.5x trailing earnings, COST commands a substantial premium across every valuation metric relative to retail peers.2 The table below shows how that premium compares:
CompanyBusinessTrailing P/EForward P/EP/BEV/EBITDAROEROIC
COSTCostco — warehouse club53.5x45.5x14.2x33.2x29.7%21.2%
WMTWalmart — mass merchant + Sam's Club42.4x36.7x9.6x22.9x25.5%15.0%
BJBJ's Wholesale Club (Northeast/Mid-Atlantic)19.9x17.8x5.1x12.0x27.9%12.9%
TGTTarget — general merchandise16.6x14.2x3.5x9.1x22.0%10.1%
DGDollar General — small-box discount15.4x13.3x2.7x11.7x19.0%6.7%
KRKroger — supermarket chain43.5x*12.0x7.0x7.2x14.1%3.6%
*Kroger's trailing P/E is elevated due to a one-time item; forward P/E of 12.0x is the more relevant figure. Sources: Finviz.23456
The COST premium over its closest structural analog — BJ's Wholesale Club, which runs the same warehouse club format — is the most direct comparison. BJ trades at roughly 20x trailing earnings against COST's 53.5x. That is a 2.7x valuation gap for what is nominally the same business model. The gap is justified by scale (Costco's ~891 global warehouses versus BJ's ~250, nearly all concentrated in the eastern U.S.), geographic reach (Costco operates in 14 countries; BJ is domestic only), ROIC (21.2% vs. 12.9%), and the recognition value of the Costco brand and Kirkland Signature private label.
Historical context: A reliable 5-year P/E mean for COST is not available in the collected data — this is a genuine gap. From industry references, COST has historically traded in the 35–45x range over much of the past decade, with the current 53.5x sitting somewhat above that band. That the stock trades above its own historical average P/E is worth noting. Whether the premium reflects a genuine re-rating (the FY2024 and FY2025 membership fee increases effectively expanded earnings power structurally) or simple multiple expansion is a judgment call. The 5-year earnings CAGR of 10.1% and the forward P/E of 45.5x imply the market is pricing in continued double-digit EPS growth. The PEG ratio of 4.15x is high in absolute terms, though PEG ratios are less reliable benchmarks for low-growth consumer staples companies with sticky cash flows.2

Balance sheet health

Costco's balance sheet is conservative by any measure.1
  • Debt/equity: 0.20 (long-term debt $5.79B vs. equity $29.16B as of FY2025). D/E has declined every year from 0.41 in FY2021 to 0.20 in FY2025, as debt is being paid down while equity expands
  • Interest coverage: 67.4x (operating income $10.38B / interest expense $154M). Effectively no debt-servicing risk
  • Current ratio: 1.03 as of FY2025 (recovered from a dip to 0.97 in FY2024, when the $15/share special dividend reduced cash). This is intentionally tight — Costco collects cash from members and merchandise customers before paying suppliers, so a current ratio near 1.0 is normal and not a liquidity concern
  • Near-term maturities: Only $75M of long-term debt is classified as current as of FY2025. Most debt is long-dated notes
The dividend policy reinforces the balance sheet picture. Regular quarterly dividends totaled $2.18B in FY2025 (a 27% payout ratio). Costco has also paid two large special dividends funded from accumulated cash: $10/share in December 2020 and approximately $15/share in January 2024, the latter totaling approximately $6.7B. The pattern suggests another special dividend is possible, though not imminent — the prior spacing was roughly three to four years.
Most recent dividend action: on April 16, 2026, Costco announced a 13% increase in its quarterly dividend (annualized to $5.46 per share), with a record date around May 1, 2026. At the current stock price, the regular dividend yield is approximately 0.53%.2

Competitive moat

링크 미리보기를 불러오는 중…
The warehouse club format has three structural advantages that compound over time.
Membership as a loyalty lock: once a household or business pays $65–$130 annually, they are economically incentivized to consolidate purchasing at Costco to recover the fee. This produces higher basket sizes and more frequent visits than typical supermarket shopping. Costco has historically reported North American renewal rates in the low 90s percent range — reflecting genuine perceived value rather than inertia.
The low-SKU, high-volume pricing engine: with roughly 4,000 SKUs versus a supermarket's 30,000+, Costco can negotiate far more aggressively on each item. Suppliers compete intensely for inclusion, knowing that a Costco listing means very high volume at very low margin. The markup ceiling of approximately 14% (enforced internally) is a credible commitment that Costco will not gradually erode the value proposition, which in turn sustains the renewal rate. This is a self-reinforcing loop: tight margins → high renewal → scale → tighter supplier terms → even tighter margins.
Kirkland Signature as a quality-and-value signal: the private label has achieved something unusual — premium brand perception at below-branded prices. That positioning is difficult to replicate quickly and further insulates Costco from price comparison with Amazon or Walmart on an item-by-item basis.
The most direct competitors in the warehouse club segment are Sam's Club (a Walmart subsidiary, roughly 600 U.S. locations) and BJ's Wholesale Club (approximately 250 locations, primarily in the eastern U.S.). Sam's Club raised its membership fee in April 2026, which analysts viewed as a potential signal that BJ and Costco could follow — though Costco's last increase was in September 2024 (the first since June 2017), making another increase in the near term unlikely based on historical cadence.4
Amazon Prime (a broader ecosystem), Walmart+ (mass merchant), and online grocery delivery platforms apply indirect competitive pressure, particularly on the convenience dimension. Costco's response has been measured expansion of e-commerce and same-day delivery partnerships rather than a structural pivot — consistent with protecting in-warehouse traffic, which drives the bulk of membership renewal intent.

Risk factors

Valuation that assumes continued strong growth.
  • Trigger: any quarterly result where EPS growth comes in below ~10%, or where management signals a membership fee increase that falls flat on renewal rates
  • Magnitude: At 53.5x trailing and 45.5x forward P/E, the stock has minimal cushion for disappointment. If the growth rate moderates toward the lower end of the historical 8–10% range and the multiple compresses toward the peer-median range of 20–35x, the downside is material — though quantifying a specific percentage would require assumptions about future earnings that are not justified by current data alone
  • Timeline: Q3 FY2026 earnings on May 28, 2026 (AMC) is the next hard data point; year-over-year EPS comparison will be closely watched
Insider ownership at 0.21% with consistent net selling.
  • Over the past 12 months, all disclosed insider transactions have been sales — no purchases. Recent significant transactions include EVP Caton Frates selling 700 shares at $993 on April 1, 2026 (value ~$695K), EVP Adamo Claudine selling 730 shares at $1,003 on March 9, 2026 (~$732K), and EVP Klauer James selling 1,500 shares at $939 on January 14, 2026 (~$1.4M).2 The net insider change over 12 months is −0.89%. Insider selling at premium valuations is common and does not by itself indicate a negative outlook — but the absence of any buyer among the insider group is a data point worth noting
  • Short interest is low at 1.52% of float (6.73M shares, short ratio 3.62 days), so no meaningful short-squeeze or crowded-short dynamic exists2
Consumer spending pressure.
  • High gasoline prices weigh on the discretionary portion of household budgets, which in theory could reduce big-box trip frequency. Walmart's CFO John David Rainey noted in May 2026 that some consumers are buying less than a full tank of gas at a time — a sign of demand-side strain at the margin. Kroger CEO Greg Foran announced aggressive price cuts in the same period to compete directly with Walmart, Costco, and Amazon. Costco's defensive positioning (essential goods, value orientation) partially mitigates this risk, but the company is not immune to a broad consumer pullback2
  • Trigger: a sustained decline in same-store sales traffic; timeline: reported with each earnings release
Membership fee dependency.
  • The fee income stream is the engine of Costco's profit model. If renewal rates declined by 3–5 percentage points (from ~92% to ~87–89%), the impact on operating income would be disproportionate, since fee income carries very high incremental margins. A stress event (recession, significant brand damage) that reduced renewal rates would hurt earnings well beyond the face-value fee revenue decline. Quantifying the magnitude requires data on the exact fee income contribution to operating income that is not broken out in collected filings
International expansion risk.
  • Costco continues expanding in China and other overseas markets where brand recognition, real estate costs, and regulatory conditions differ substantially from North America. International operations carry currency, political, and execution risks that are difficult to quantify precisely from public filings alone

Near-term catalysts

Q3 FY2026 earnings — May 28, 2026 (after market close): this is the most immediate catalyst. Results will cover the fiscal quarter ending approximately May 11, 2026. The market's attention will be on comparable-sales growth, membership renewal rates, and any commentary on fee income trends following the September 2024 increase.2
Analyst consensus: 2.03 on a 1–5 scale (Buy), average price target $1,093.59 — implying approximately 6.4% upside from the May 22 close of $1,028.24. Analysts should be noted as having a systematic optimism bias; target prices are directional, not precise. The most recent actions: Telsey Advisory Group (April 9, 2026) raised its target from $1,125 to $1,135 and reiterated Outperform; BofA Securities (February 27, 2026) initiated at Buy with a $1,185 target. A dissenting view: Roth Capital (December 15, 2025) downgraded to Sell with a $769 target, citing valuation.2 The gap between BofA's $1,185 and Roth's $769 is itself informative — the bull-bear debate on COST is almost entirely about the appropriate multiple, not about business quality.
52-week context: COST is currently at the 87th percentile of its 52-week range ($844.06 low to $1,096.50 high), down 6.2% from the 52-week high. YTD it has returned +19.24%.2

Thesis in brief

Costco passes all three hard screening criteria with comfortable margins: FY2023–FY2025 ROE of 25.1% / 31.2% / 27.8% (all above 15%), consistently positive FCF ($6.75B / $6.63B / $7.84B), and a valuation that — while expensive in absolute terms — is premium-justified by superior capital returns and structural moat depth relative to retail peers.1
The central investor question is not whether Costco is a great business — the data make that clear. The question is whether 53x trailing earnings is a price that leaves enough room for compounding. At 10% annual EPS growth (roughly the 5-year average), earnings will double in about seven years. Whether today's buyer earns a satisfactory return over that period depends almost entirely on where the multiple sits at exit. That is a question about future market sentiment, not about Costco's operating fundamentals — and it is the main risk factor to weigh heading into Thursday's earnings.
All financial data sourced from SEC EDGAR XBRL filings (CIK 0000909832) and Finviz as noted. Analyst targets and short interest data represent consensus as of May 2026. This article is for research purposes only and does not constitute investment advice. Verify all data independently before making investment decisions.
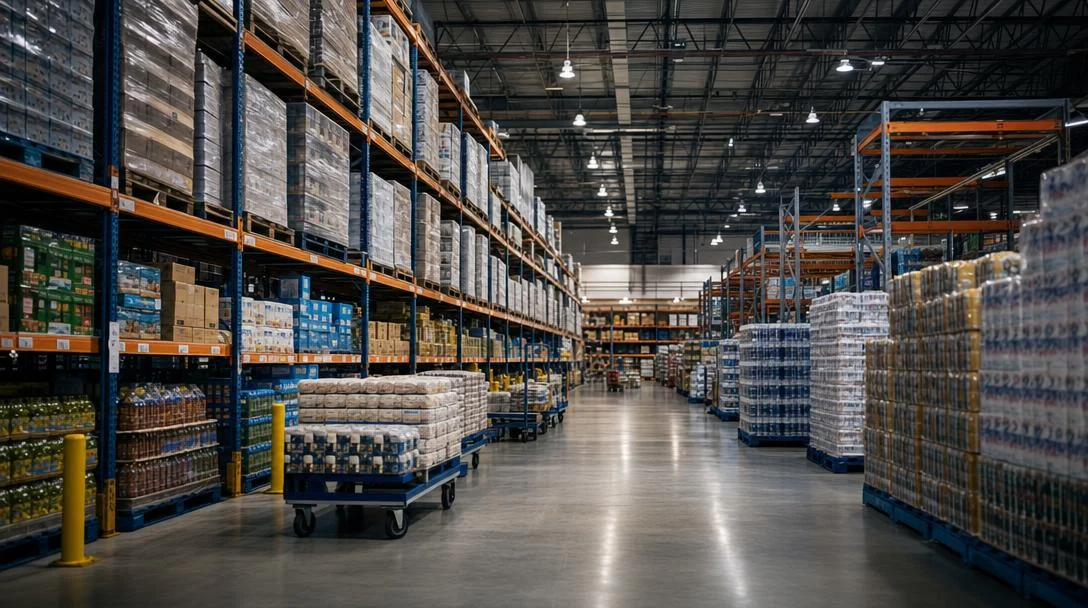
Cover image: AI-generated illustrative image of a warehouse retail interior

이 콘텐츠를 둘러싼 관점이나 맥락을 계속 보강해 보세요.

  • 로그인하면 댓글을 작성할 수 있습니다.