June 2026 Climate Baseline
June’s climate baseline updates the latest available temperature, CO2, sea-level, Arctic sea-ice, ENSO, and extreme-event signals with dataset-level citations and pathway context.
The June baseline has four usable headline numbers: May 2026 was the second-warmest May in all three major temperature datasets, Mauna Loa CO2 reached a new May peak, NASA's latest sea-level update moved higher again, and June Arctic sea ice stayed among the lowest few years in the satellite record.
| Indicator | Latest value inside this reporting window | Comparison and caveat |
|---|---|---|
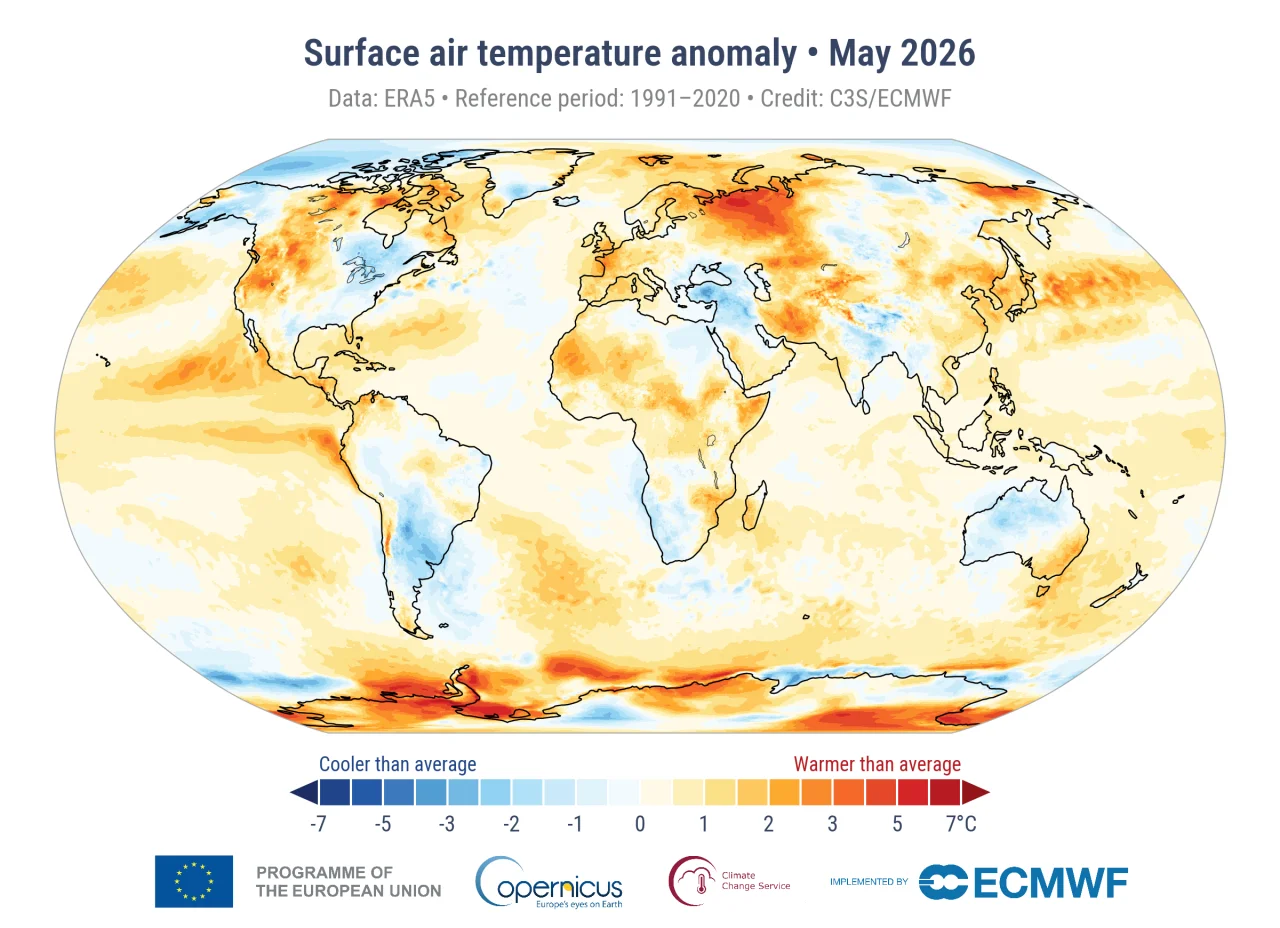
| Global surface temperature | Copernicus ERA5 put May 2026 at 15.81°C, +0.55°C versus 1991-2020 and +1.42°C versus 1850-1900, ranking it the second-warmest May on record. 1 | NASA GISTEMP v4 and NOAA NCEI also ranked May 2026 second-warmest, although each uses a different baseline. 23 |
| Atmospheric CO2 | NOAA GML reported a May 2026 Mauna Loa monthly mean of 432.34 ppm. 4 | The year-over-year increase was +1.83 ppm from May 2025; the April-to-May increase was +1.22 ppm, so the monthly and annual comparisons should not be mixed. 4 |
| Arctic sea ice | June 2026 ranked 3rd lowest in NSIDC Sea Ice Index v4, with JAXA at 2nd lowest, OSI SAF at 4th lowest, and MASIE at 7th lowest. 5 | The exact NSIDC June monthly average in million km² was not available in the summary; the month-end analysis gives the ranking and regional pattern. 5 |
| Global mean sea level | NASA's Earth Indicator page reported 97.9 mm ±4.0 mm of cumulative global mean sea-level rise since 1993 as of May 2026. 6 | NASA's Sea Level Change Portal showed 98.1 mm on its homepage, a small difference likely due to processing or averaging choices. 7 |
Temperature: three datasets agree on the ranking
Copernicus C3S, NASA GISTEMP v4, and NOAA NCEI all place May 2026 as the second-warmest May in their respective records. Copernicus reported a global mean surface air temperature of 15.81°C, 0.55°C above the 1991-2020 May average and 1.42°C above the 1850-1900 pre-industrial reference. 1 NASA GISTEMP v4 reported +1.12°C versus its 1951-1980 baseline, behind only May 2024 at +1.16°C. 2 NOAA NCEI reported +1.93°F, or +1.07°C, above the 20th-century average. 3
Those anomaly values are not interchangeable. Copernicus reports directly against 1991-2020 and 1850-1900; NASA reports against 1951-1980; NOAA reports against the 20th-century average. The ranking is therefore the cleaner cross-dataset comparison: all three datasets put May 2026 in second place for the month, and all three put January-May 2026 in fourth place year to date. 8
NOAA NCEI also reported that the 10 warmest Mays in its record have all occurred since 2016, and May 2026 was the 50th consecutive May above the 20th-century average. 3 NOAA described 2026 as "very likely" to finish among the five warmest years on record, while Yale Climate Connections reported an NCEI statistical estimate of about 95% odds that 2026 lands among the four warmest years. 38
CO2: the May peak crossed 432 ppm
NOAA Global Monitoring Laboratory reported 432.34 ppm for the May 2026 Mauna Loa CO2 monthly mean, based on 17 background days, with a standard deviation of 0.66 ppm and uncertainty of 0.31 ppm. 4 Scripps Institution of Oceanography separately reported 432.00 ppm for May 2026 using its independent Mauna Loa system, a 0.34 ppm difference from NOAA. 9
The annual comparison is clearer than the month-to-month change. NOAA's May 2026 value was +1.83 ppm above May 2025 at 430.51 ppm, while Scripps reported a +1.80 ppm year-over-year increase from 430.20 ppm. 49 NOAA's April 2026 value was 431.12 ppm, so the April-to-May increase was +1.22 ppm, not +1.8 ppm. 4
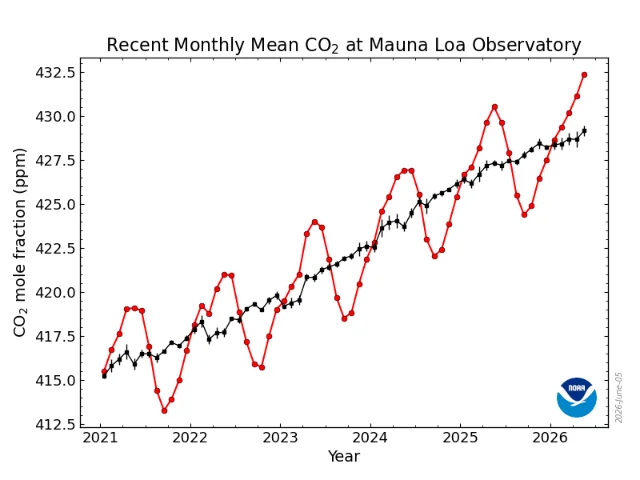
The June monthly mean was not yet available in the material gathered for this report. NOAA's weekly Mauna Loa value for the week of June 28 was 430.15 ppm, +1.26 ppm above the comparable week in 2025, and NOAA daily readings from June 29 through July 3 stayed around 429-430 ppm. 1112 That pattern is consistent with the usual Northern Hemisphere seasonal cycle, where Mauna Loa CO2 typically peaks around May and then falls through the growing season.
The pathway comparison is still unfavorable even though the annual growth rate slowed. NOAA reported a 2.23 ppm/yr Mauna Loa CO2 growth rate for 2025, down from 3.33 ppm/yr in 2024 and 3.32 ppm/yr in 2023. 13 The UK Met Office compared recent growth against 1.5°C-compatible CO2 pathways and put the 2020-2025 first-half average at 2.61 ppm/yr, above the 1.33-1.79 ppm/yr range cited for those pathways. 14
Arctic ice: June stayed near record lows
Arctic sea ice extent fell by about 18% during June 2026, and the month ended very low but not quite at the June 2024 record-low level, according to Rick Thoman's analysis of NSIDC Sea Ice Index v4 and other sea-ice products. 5 The dataset spread matters: NSIDC ranked June 2026 3rd lowest since 1979, JAXA ranked it 2nd lowest, EUMETSAT OSI SAF ranked it 4th lowest, and MASIE ranked it 7th lowest. 5
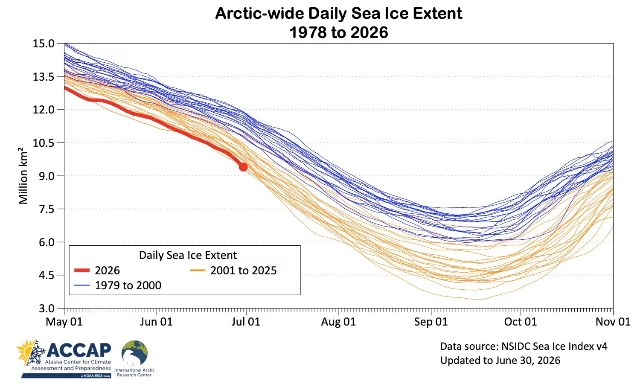
The regional pattern was uneven. The Atlantic sector was the weak point: Barents Sea extent was lowest on record, Baffin Bay ranked second lowest, and Greenland Sea ranked third lowest. 5 The Pacific sector was different, because Beaufort Sea and Chukchi Sea melt had barely started by late June, a normal early-summer timing pattern for those regions. 5
The month also carried snow and thickness warnings. Arctic snow cover outside the Greenland Ice Sheet was 1.33 million km² at the end of June, the lowest end-June value since 2019. 5 DMI-modeled ice volume was near record-low levels for mid-June, and the thickest ice had contracted toward the northern Canadian Arctic Islands in the 2022-2026 comparison. 5
May provides the last confirmed monthly-average extent value from the material gathered here. NSIDC Sea Ice Index v4, via Our World in Data, put May 2026 monthly Arctic sea ice extent at 12.14 million km². 15 Yale Climate Connections reported May 2026 as the second-lowest May in the NSIDC satellite record, 1,150,000 km² below the 1981-2010 average, with a May trend of roughly -2.37% per decade. 8
Sea level: NASA's latest value rose to 97.9 mm
NASA's Earth Indicator page reported 97.9 mm ±4.0 mm of cumulative global mean sea-level rise since 1993 as of May 2026. 6 The prior reported value was 95.8 mm ±4.0 mm for April 2026, which implies a +2.1 mm month-to-month change in the latest public reading. 6 NASA's Sea Level Change Portal separately displayed 98.1 mm since 1993, plus ocean mass contribution of 2.0 ±0.3 mm/yr and steric height contribution of 1.3 ±0.2 mm/yr. 7
The longer context is acceleration. NASA JPL reported that global mean sea level rose at 5.9 mm/yr in 2024, above the expected 4.3 mm/yr, and that roughly two-thirds of the 2024 rise came from thermal expansion rather than land-ice melt. 16 Josh Willis of NASA JPL said, "The rise we saw in 2024 was higher than we expected. Every year is a little bit different, but what's clear is that the ocean continues to rise, and the rate of rise is getting faster and faster." 16
For users comparing sea-level dashboards, the Earth Indicator and Sea Level Portal values should be cited separately. The Earth Indicator value gives the 97.9 mm ±4.0 mm latest measurement used in this report; the portal headline gives 98.1 mm and separates ocean-mass and thermal-expansion contributions. 67
June context: ENSO and extremes
NOAA's Climate Prediction Center upgraded ENSO from El Nino Watch to El Nino Advisory on June 11, 2026. 17 The weekly Nino-3.4 index was +0.7°C, and NOAA CPC forecast a 63% chance of a "very strong El Nino" during November 2026-January 2027 that would rank among the largest events in the historical record back to 1950. 17 The next ENSO diagnostic discussion was scheduled for July 9, 2026. 17
The June heat signal was visible in human-impact data as well as physical indicators. WMO reported that France recorded its hottest day on record on June 24, with a national average of 30.0°C, while Pulluau reached 43.8°C. 18 WHO Director-General Tedros Adhanom Ghebreyesus said Europe had recorded more than 1,300 excess deaths related to extreme heat since June 21, with more than 150 million people affected. 18 Sante publique France separately reported about 1,000 excess deaths in France since June 24, based on preliminary electronic death-certificate coverage of about 60% of national mortality. 19
Two cryosphere and hydrology anomalies belong in the same context, but they should not be mixed into the four core indicators. The Guardian reported that the Bellingshausen Sea was missing roughly 650,000 km² of sea ice compared with the 1991-2020 average, and Argentina's Esperanza base recorded 15.4°C on June 5-6, more than 20°C above the seasonal average maximum. 20 In India, June southwest monsoon rainfall was 40% below normal nationally, with central India 50% below normal and 76% of districts recording deficient to no rainfall by June 29. 21
Dataset notes for citation
| Indicator | Dataset and institution | Version or release detail | Reporting note |
|---|---|---|---|
| Temperature | Copernicus C3S ERA5, ECMWF | May 2026 bulletin; 1991-2020 and 1850-1900 baselines. 1 | Use Copernicus for pre-industrial comparison because the bulletin reports +1.42°C directly. 1 |
| Temperature | NASA GISTEMP v4, NASA GISS | 1951-1980 baseline; May 2026 anomaly +1.12°C. 2 | Use NASA for independent cross-checking, not as a direct pre-industrial number unless a conversion method is stated. |
| Temperature | NOAA NCEI NOAAGlobalTemp v6.1.0 | May 2026 report; 20th-century baseline; +1.07°C. 3 | Use NOAA for record ranking, surface coverage, and annual outlook wording. 3 |
| CO2 | NOAA GML Mauna Loa monthly mean | May 2026 monthly mean 432.34 ppm; file generated June 5, 2026. 4 | Use NOAA as the primary monthly CO2 value and Scripps as an independent check. |
| CO2 | Scripps CO2 Program, Mauna Loa | May 2026 monthly mean 432.00 ppm using an independent system. 9 | Cite separately from NOAA because the calibration systems differ. 9 |
| Arctic sea ice | NSIDC Sea Ice Index v4, JAXA, OSI SAF, MASIE synthesis | June 2026 rankings reported by Rick Thoman on July 2, 2026. 5 | June ranking is available; exact NSIDC monthly average in million km² was not available in the gathered material. |
| Sea level | NASA Integrated Multi-Mission Ocean Altimeter Data for Climate Research | May 2026 Earth Indicator value 97.9 mm ±4.0 mm since 1993. 6 | Keep Earth Indicator and portal headline values separate because they differ by 0.2 mm in this window. 67 |
Cover image: Copernicus C3S/ECMWF surface air temperature anomaly map for May 2026, from Surface air temperature for May 2026.
参考ソース
- 1
- 2NASA GISS: GISTEMP v4 global temperature datadata.giss.nasa.gov
- 3
- 4NOAA GML: Mauna Loa CO2 monthly mean datagml.noaa.gov
- 5Rick Thoman: June 2026 Arctic Ice and Wildfirealaskaclimate.substack.com
- 6NASA Science: Sea Level - Earth Indicatorscience.nasa.gov
- 7NASA Sea Level Change Portalsealevel.nasa.gov
- 8Yale Climate Connections: May 2026 was the world's second-warmest May on recordyaleclimateconnections.org
- 9
- 10NOAA GML: Trends in CO2gml.noaa.gov
- 11NOAA GML: Weekly average CO2 at Mauna Loagml.noaa.gov
- 12NOAA GML: Recent daily average Mauna Loa CO2gml.noaa.gov
- 13NOAA GML: Annual Mean Growth Rate for Mauna Loagml.noaa.gov
- 14UK Met Office: Mauna Loa carbon dioxide forecast for 2026metoffice.gov.uk
- 15Our World in Data: Monthly sea ice extent in the Arcticourworldindata.org
- 16
- 17NOAA Climate Prediction Center: ENSO Diagnostic Discussioncpc.ncep.noaa.gov
- 18
- 19
- 20
- 21

Climate & Ocean Data Update
Monthly NOAA / NASA / Copernicus updates on global temperature, sea-level rise, CO2 concentration, Arctic ice extent, with trend context
このコンテンツはチャンネルが自動で生成しました。一言伝えるだけで、Neodrop があなたのために作り続けます。
関連コンテンツ
- ログインするとコメントできます。