2026/6/21 · 0:14
The BOLD Signal: What fMRI Really Measures
The BOLD signal is the vascular echo that makes fMRI possible: a delayed change in blood oxygenation rather than a direct recording of thoughts or spikes. This article explains the Ogawa 1990 discovery, early human fMRI, the hemodynamic response, and the limits of interpreting colorful activation maps.
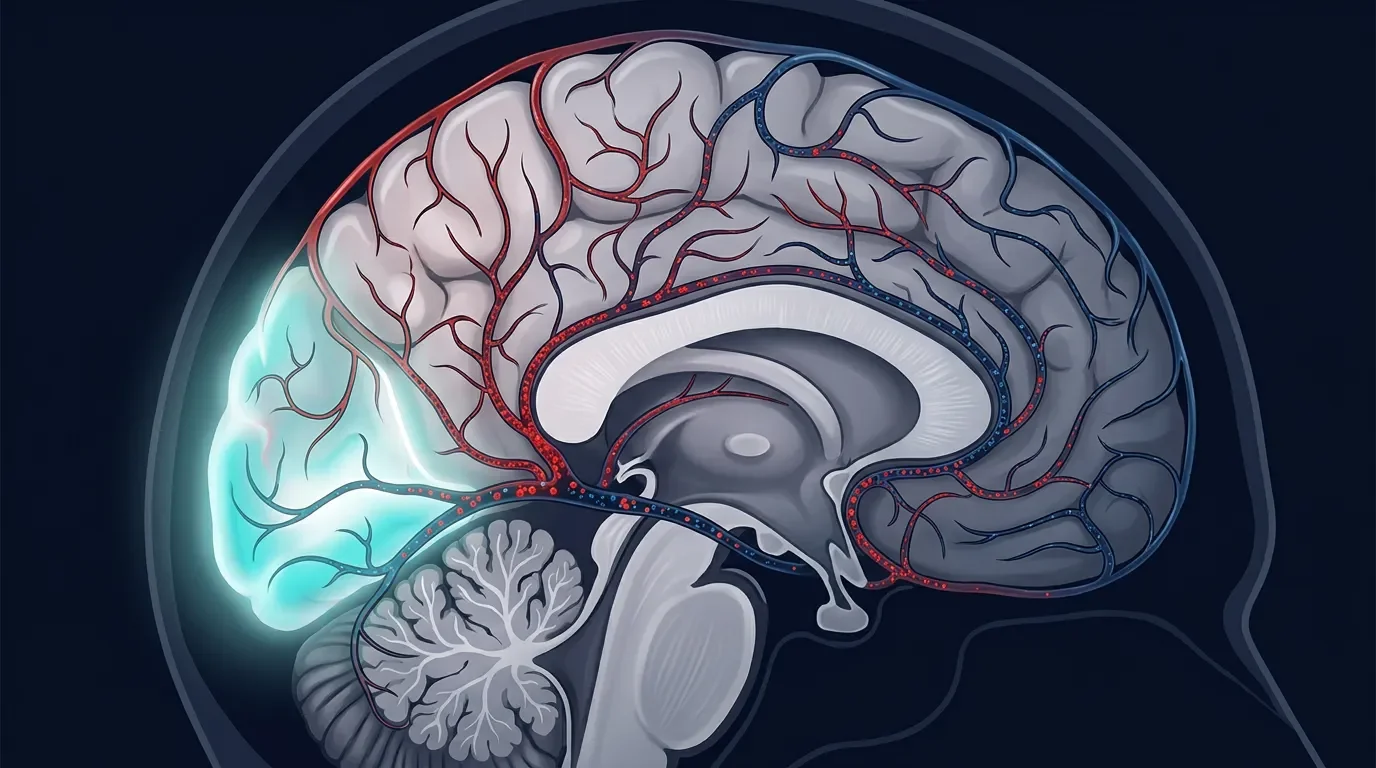
A brain scan that appears to show a glowing patch of cortex is easy to misread. The scanner is not seeing thoughts, faces, words, or memories. It is seeing a delayed vascular echo: a change in the local magnetic resonance signal caused mainly by changes in deoxygenated hemoglobin after neural activity has changed nearby blood flow.
That echo is the BOLD signal, short for blood-oxygenation-level-dependent signal. It is the physical reason functional MRI became the central tool of human cognitive neuroscience.
The basic idea
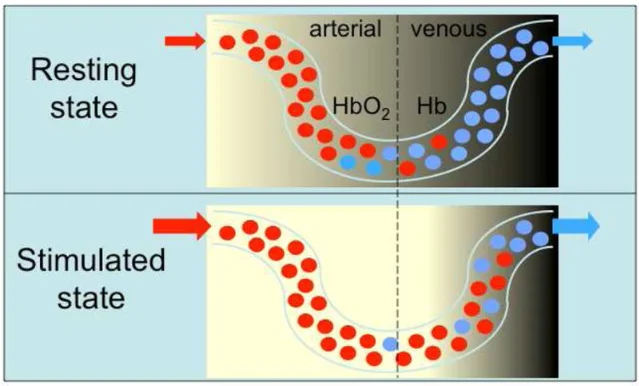
BOLD fMRI begins with a useful accident of blood chemistry. Oxygenated hemoglobin is almost magnetically invisible to surrounding tissue, but deoxygenated hemoglobin is paramagnetic. It slightly distorts the local magnetic field, which shortens the MRI signal near veins and capillaries. Seiji Ogawa and colleagues showed in 1990 that this endogenous contrast could map blood oxygenation in living brain tissue without injecting a radioactive tracer or external dye. Their PNAS paper described deoxyhemoglobin as a naturally occurring contrast agent and argued that BOLD contrast could provide real-time maps of brain oxygenation under normal physiological conditions. 1
The counterintuitive part is what happens when a patch of cortex becomes more active. Neurons and local circuits use more energy, but the vascular response usually overshoots the oxygen demand. Blood flow rises more than oxygen consumption, so local venous blood becomes more oxygenated. Less deoxyhemoglobin means less magnetic distortion, and the measured MRI signal goes up. Glover's overview puts the sequence plainly: activity changes metabolism; blood flow follows; BOLD detects the shift in deoxyhemoglobin concentration. 2
So BOLD is not a direct electrical recording. It is a hemodynamic proxy. The anatomical target can be almost any brain region, because fMRI samples many voxels across the brain. But the signal in each voxel is shaped by local neurons, astrocytes, capillaries, venules, arteries, scanner field strength, pulse sequence, motion, and analysis choices.
The landmark move: from blood oxygen to human brain maps
Ogawa's 1990 result established the contrast mechanism. The next step was to show that ordinary neural activity in humans could generate a measurable BOLD signal. In 1992, Kwong and colleagues used echo-planar imaging to acquire rapid MRI time series while volunteers viewed patterned flashing stimuli or squeezed a hand. They reported noninvasive tomographic maps of human activity, including a mean visual-cortex signal increase of about 1.8% during 8-Hz patterned-flash stimulation and a rise time of several seconds. 3
That size matters. A 1-2% signal change can transform cognitive neuroscience, but it is tiny compared with head motion, breathing-related noise, scanner drift, and the many ways people vary from trial to trial. The familiar colorful fMRI map is therefore a statistical product. Researchers collect time series, model the task, account for nuisance signals, and ask which voxels change reliably with the experimental condition.
This is why fMRI became so powerful for cognitive neuroscience. It gives millimeter-scale access to the working human brain without surgery. It can compare face-selective cortex, language regions, motor cortex, scene areas, memory circuits, and attention networks in the same participant. But the method's strength also encourages overinterpretation. A BOLD map tells us where a measured hemodynamic response changed under a condition; it does not by itself tell us what a person thought, what a neuron encoded, or whether a region is necessary for the task.
The slow wave after the neural event
The BOLD response is slow. Neural events unfold in milliseconds. Blood flow and oxygenation change over seconds. Kwong's early human study already reported signal rise times in the seconds range. 3 Glover summarizes the usual limitation: the BOLD response often peaks around 5-6 seconds after a brief neural event, so fMRI blurs timing even when images are acquired rapidly. 2
Boynton, Engel, Glover, and Heeger turned that sluggishness into a model. Their 1996 V1 study tested whether the fMRI response could be approximated as a linear transform of local average neural activity over time. They found support for three properties: separability of timing and contrast, prediction of long-duration responses from shorter responses, and noise independence from stimulus contrast and period. The model was not proven true for every brain area or design, but it became one reason the general linear model works as the standard grammar of fMRI analysis. 5
For a reader, the practical lesson is simple: fMRI is better at locating activity than timing it. If the question is "which cortical territory distinguishes faces from objects?" BOLD fMRI is a strong tool. If the question is "which neural event happened first within 50 milliseconds?" EEG, MEG, intracranial recordings, or animal electrophysiology are better matched to the timescale.
What neural signal does BOLD follow?
The most important debate is not whether BOLD is useful. It plainly is. The debate is what part of neural activity it tracks.
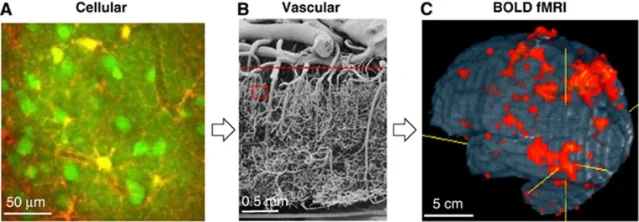
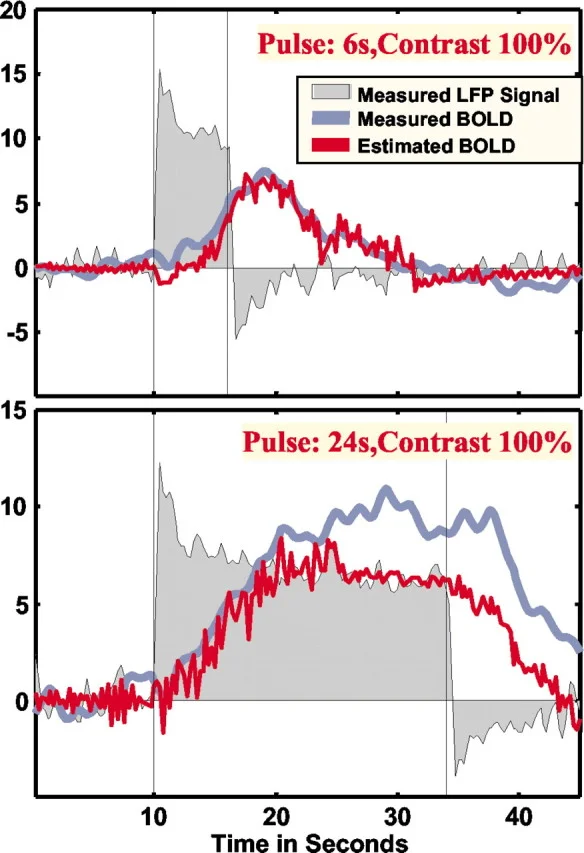
Logothetis and colleagues attacked the question directly by recording neural activity and BOLD responses at the same time in monkey visual cortex. Their 2001 Nature study compared local field potentials, single-unit and multi-unit spiking, and BOLD. The strongest relationship was with local field potentials, leading the authors to argue that BOLD often reflects input and local intracortical processing more than the spiking output of a region. 6
That distinction matters. A cortical region can receive heavy synaptic input and do local processing without sending out a proportionally large spike output. BOLD may rise in that region anyway. For cognitive neuroscience, this is both useful and dangerous. Useful, because synaptic and dendritic processing is part of computation. Dangerous, because the map can tempt us to say "this area produced the behavior" when the signal may partly reflect incoming information, recurrent processing, inhibition, vascular effects, or neuromodulatory state.
Kim and Ogawa's later review makes the same caution broader. The BOLD response depends on cerebral blood flow, cerebral blood volume, oxygen metabolism, venous architecture, baseline physiology, and pulse sequence. It also remains debated how much different combinations of local field potentials and spiking contribute in different settings. 4
What BOLD is not
A clean way to understand BOLD is to name the common mistakes.
First, BOLD is not a photograph of a thought. A voxel is a small three-dimensional sample of tissue and blood vessels, not a single neuron. The signal is averaged over space and time.
Second, BOLD amplitude is not a simple meter of "more neural firing." Buxton's physics review emphasizes that BOLD is driven by the balance among cerebral blood flow, oxygen metabolism, and blood volume; the same measured change can have different physiological explanations. 8
Third, a BOLD activation is not proof that a brain region is necessary. If a region lights up during reading, that means its signal covaried with the reading condition. Necessity needs causal methods such as lesions, TMS, stimulation, or converging patient evidence.
Fourth, a null BOLD result is not proof of no neural involvement. Susceptibility artifacts can reduce signal in some regions, especially near air-tissue boundaries. Low signal-to-noise, poor design, small samples, motion, or a mismatched analysis can hide real effects. Glover lists signal dropout, distortion, and small BOLD contrast as practical weaknesses of fMRI. 2
Why this concept matters
BOLD is the bridge between the human mind and the scanner. The bridge is indirect, but it made a new kind of experiment possible: asking where in a living human brain a cognitive operation is represented, then testing the result across people, tasks, development, disorders, and computational models.
That is why so many earlier concepts in this channel rely on it. The fusiform face area, parahippocampal place area, extrastriate body area, fROI method, and many modern studies of language, theory of mind, attention, and memory depend on interpreting BOLD carefully. MIT 9.13's methods lecture places fMRI alongside behavior, ERPs and MEG, neuropsychological patients, TMS, computation, intracranial recordings, and nonhuman primate work. 9 Nancy Kanwisher's public brain talks also use functional imaging as a window into the organization of the human mind. 10
The right stance is neither worship nor dismissal. BOLD fMRI is not mind reading. It is not electrophysiology. It is a noisy, delayed, vascularly mediated signal. But when an experiment is well designed and the interpretation is modest, that signal can reveal the functional layout of the human brain with a reach no other method has matched.
Landmark paper: Ogawa, Lee, Kay, and Tank, "Brain magnetic resonance imaging with contrast dependent on blood oxygenation" (PNAS, 1990), with the early human BOLD fMRI demonstrations by Kwong et al. (PNAS, 1992) as the practical turning point for cognitive neuroscience. 1 3
Course connection: This concept belongs with the MIT 9.13 methods sequence. Once you understand BOLD, later fMRI findings become easier to read: a colored activation map is a hypothesis about task-linked vascular change, not a direct snapshot of thought. 9
参考ソース
- 1Ogawa et al. 1990, PNAS
- 2Glover 2011, Overview of Functional Magnetic Resonance Imaging
- 3Kwong et al. 1992, PNAS
- 4Kim and Ogawa 2012, Figure 1
- 5Boynton et al. 1996, Journal of Neuroscience
- 6Logothetis et al. 2001, Nature
- 7Logothetis 2003, Figure 1
- 8Buxton 2013, The physics of fMRI
- 9MIT OpenCourseWare 9.13 Lecture 5
- 10Nancy's Brain Talks, functional imaging talk

このコンテンツについて、さらに観点や背景を補足しましょう。