
XAUUSD Weekly Intel #10: After the $147 Drop — Gold at $4,328, Yearly Support in the Crosshairs, CPI Wednesday Decides
Gold enters the week of June 9–13 at $4,327–$4,338 after Friday's 3.29% NFP-driven crash confirmed a bearish break of the $4,366 six-week floor. The metal now sits $8–$16 above the yearly open support at $4,319, with $4,311 the new structural low and a confirmed 10th consecutive lower high from the ATH. DXY hit 99.81, 10-yr yield rose to 4.53%, and rate-hike odds for December jumped to 68.4%. CPI Wednesday (June 11) is the week's defining event — a hot reading locks in the hike narrative and targets $4,250–$4,200; a meaningful miss triggers a corrective bounce to $4,420–$4,453. Full channel map, news impact table, 5-day probability outlook (Bear 50%/Bounce 30%/Bull 15%/Crash 5%), and long/short setups with defined invalidation levels inside.

Pre-market brief — Week of June 9–13, 2026. Data as of Sunday June 8. Spot gold ~$4,327–$4,338. All levels confirmed from this week's market data. Forward scenarios use probabilities, not certainties. Gaps in intraday data flagged explicitly.
The Setup: What Just Happened
Technical Structure: The Floor That Became Ceiling
Confirmed Bearish Change of Character
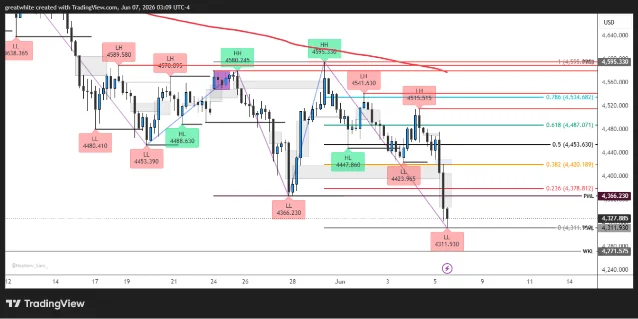
The Full Level Map
| Level | Type | Role This Week |
|---|---|---|
| $4,595 | Prior swing high | Structural ceiling — only a daily close above here invalidates bears |
| $4,534 | 0.786 Fibonacci | Deep bounce resistance |
| $4,493–$4,540 | Former monthly floor / 2026 low-week close | Primary resistance band; a weekly close above = significant near-term low confirmed 5 |
| $4,487 | 0.618 Fibonacci | Key resistance for deep corrective bounces |
| $4,453 | 0.500 Fibonacci | Equilibrium — most likely ceiling on a corrective bounce |
| $4,420 | 0.382 Fibonacci | First resistance above current price |
| $4,378–$4,380 | 0.236 Fibonacci | Nearest overhead resistance; rejection here = highest-probability short entry |
| $4,366 | Prior monthly floor → now resistance | Six-week structural floor, flipped to supply zone |
| $4,327–$4,328 | Current spot price (week open) | At base of confirmed bearish breakdown |
| $4,319 | Yearly open support | Critical weekly inflection point; reaction here is the early-week focus 5 |
| $4,311–$4,312 | New structural low (Friday intraday) | Daily close below this opens $4,250 |
| $4,250 | Psychological level | First extension target on confirmed breakdown |
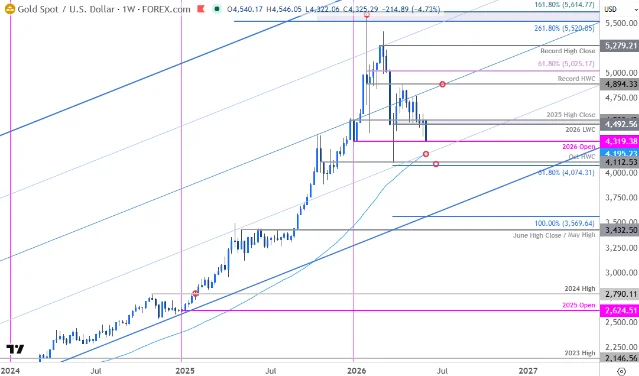
| $4,195 | 52-week MA | Converges with 25% parallel next week 5 |
| $4,074–$4,112 | 61.8% extension / 2026 yearly swing low / Oct high-week close | Deep downside target if $4,195 breaks |
Macro & Fundamental Drivers
The Rate-Hike Regime Has Flipped the Script
| Macro Indicator | Current Reading | Gold Impact |
|---|---|---|
| DXY (US Dollar Index) | ~99.81 (post-NFP high) | Bearish — strong dollar suppresses global gold demand |
| US 10-yr Treasury yield | 4.53% (+8bp on NFP day) | Bearish — rising real yields increase opportunity cost |
| US 2-yr Treasury yield | 4.16% (16-month high) | Bearish — signals front-end rate-hike pricing |
| US 30-yr yield | 4.981% | Bearish — long-end staying elevated |
| CME Dec rate hike odds | 68.4% | Bearish — market now pricing aggressive Fed |
| NFP (May 2026) | +172K vs 85K expected | Bearish — removes soft-landing / cut narrative |
| GLD holdings | ~1,025 tonnes (Jun 4) | Neutral — holdings stable; May ETF flows slowed to trickle 6 |
| US-Iran talks | Stalled — Strait of Hormuz uncertainty | Mixed — oil elevated, but no acute escalation spike |
| Central bank buying (Q1 2026) | 244 tonnes global | Bullish structural floor; not a short-term catalyst |
Geopolitical Context: The Episodic Bid
Weekly News Impact Table: June 9–13
| Date | Event | Consensus / Prior | Expected Impact on Gold | Bull Logic | Bear Logic |
|---|---|---|---|---|---|
| Mon Jun 9 | NY Fed Consumer Inflation Expectations | — | Low/moderate | Below-expectation inflation expectations = dove momentum | Above 4% 1-yr expectations = hawkish validation |
| Wed Jun 11 | US CPI May (8:30 AM ET) | ~4.2% YoY; core +0.3% MoM (prev: +0.4%) | HIGH — weekly pivot event | Core CPI ≤0.2% MoM = dovish relief bounce, gold tests $4,420–$4,453 | Core CPI ≥0.4% MoM = rate hike narrative locked in, gold breaks $4,311 |
| Thu Jun 12 | US PPI May (8:30 AM ET) | TBD; follows CPI | Moderate-High | Soft PPI = confirms inflation cooling trend | Hot PPI = producer price pipeline reinforces consumer inflation |
| Thu Jun 12 | ECB Rate Decision | +25bp expected | Low for gold directly | ECB pause/surprise = global pivot narrative = gold bounce | +25bp = rates-rising globally = dollar strength, gold down |
| Ongoing | Fed speakers (pre-FOMC blackout) | June 16 blackout begins | Moderate | Dovish tone = cuts back on table | Hawkish validation of hike pricing |
| Jun 16–17 | FOMC Meeting (Kevin Warsh) | Hold 100%; statement language critical | HIGH — next major catalyst | Warsh signals caution on hikes = gold relief | Dot plot shift toward hike = gold accelerates lower |
Note on data gaps: May CPI YoY consensus is market-derived (~4.2%), not yet an official release. Actual CPI prints Wednesday June 11 at 8:30 AM ET. PPI consensus not published at time of writing. Flag both as estimates.
5-Day Price Outlook: Mon–Fri Probability Matrix
Scenario A — Bear Continuation (50% probability)
Trigger: CPI Wednesday prints at or above consensus (+0.3% core MoM or higher). DXY holds above 99.50. No material geopolitical shock.
- Monday–Tuesday: Consolidation or shallow bounce to $4,360–$4,378, rejected at the 0.236 Fibonacci. Bears press the $4,319–$4,311 zone.
- Wednesday (CPI): Hot print → immediate break below $4,311; targets $4,250 within the session.
- Thursday–Friday: Extension toward $4,200–$4,195 (52-week MA). Market prices 2+ hikes by year-end.
- End-of-week target: $4,200–$4,250
Scenario B — Dead-Cat Bounce, Then Resume Lower (30% probability)
Trigger: CPI slightly below consensus (core +0.2% MoM). Relief bounce, but macro backdrop stays hawkish.
- Monday–Tuesday: Gold stabilizes at $4,319–$4,327, short-covering bounce to $4,420–$4,453.
- Wednesday (CPI): Softer read → spike to $4,453–$4,487. Cannot hold — DXY and yields only modestly lower.
- Thursday–Friday: Fade back toward $4,350–$4,366. Weekly close below $4,366 preserves bearish structure.
- End-of-week target: $4,340–$4,400. Does not invalidate bears.
Scenario C — Genuine Bullish Reversal (15% probability)
Trigger: CPI meaningfully misses (core ≤0.1% MoM), plus an acute geopolitical shock (Iran escalation, supply disruption), or hawkish Fed walk-back.
- Gold reclaims $4,366 on a daily close.
- Weekly close above $4,493–$4,540 needed to suggest a significant low is in.
- End-of-week target if triggered: $4,487–$4,540
- This scenario requires multiple simultaneous catalysts; treat it as tail, not base.
Scenario D — Outright Crash (5% probability)
Trigger: CPI crushes expectations to the upside AND simultaneous hawkish shock from multiple Fed speakers pre-blackout.
- Immediate break of $4,311 → $4,250 → potential test of $4,195 (52-week MA) by Friday.
- End-of-week target: $4,150–$4,195
Trading Setups
Channel rule: No chasing mid-range. Entries only near defined S/R with a confirmation signal. Every trade requires a pre-defined invalidation level.
Long Setup — Only on Scenario B or C
- Entry zone: $4,319–$4,327 (yearly open support + current price base)
- Trigger required: 4H bullish rejection candle (hammer, engulfing) closing above $4,327 with above-average volume, OR a 1H close above $4,350 on below-consensus CPI Wednesday
- Targets: T1: $4,378–$4,380 (0.236 Fib); T2: $4,420 (0.382 Fib); T3: $4,453 (0.500 Fib — only on strong CPI miss)
- Invalidation: Daily close below $4,311 (new structural low). If triggered, exit immediately — you are in the break, not the bounce.
- No-trade condition: Any sign of consolidation below $4,327 without a clear rejection candle. Falling knife risk.
Short Setup — Primary Bias
- Entry zone: $4,366–$4,380 (prior monthly floor, now resistance; 0.236 Fib zone)
- Trigger: 4H bearish rejection candle (shooting star, bearish engulfing) with close below entry zone
- Stop: Above $4,400 (adds $20–$34 cushion above resistance; a close above invalidates the flip)
- Targets: T1: $4,311; T2: $4,250; T3: $4,200
- Entry zone: Retest of $4,311–$4,320 after a confirmed daily close below $4,311
- Stop: Above $4,330
- Targets: $4,250 → $4,195 → $4,112
No-Trade Conditions
- Pre-CPI Wednesday morning (after 8 AM ET): Do not enter new positions 30 minutes before the 8:30 AM release. Spread and gap risk.
- Mid-range (i.e., between $4,340–$4,365): This zone sits between the structural low and the flipped floor — no defined edge in either direction.
- Pre-FOMC June 16: If price is drifting in the $4,320–$4,380 range the week of June 9 without a clean technical trigger, preserve capital for the post-FOMC directional move.
Add more perspectives or context around this Post.