Stablecoin liquidity daily (Jun 4): USDT burn eases to −$301.2M, BTC hits $61K as $1.76B in longs are wiped

Stablecoin liquidity daily (Jun 4): USDT burn eases to −$301.2M, BTC hits $61K as $1.76B in longs are wiped

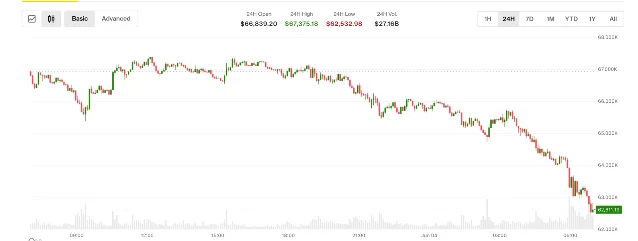
Day 8 of USDT's burn cycle lands at −$301.2M (easing from Day 7's −$460.7M), with the five-session cumulative at −$995.4M. USDC's one-day bounce failed immediately (−$113.3M), DAI continues steady erosion (−$12.1M), and Big-3 combined shed −$426.7M in 24h / −$2.52B over 7 days. The session's market context is dominated by BTC's crash to $61,300 (Feb-2026 low), $1.76B in long liquidations, and 16 consecutive ETF outflow days totaling $4.37B. Strategy's first BTC sale since 2022 (32 BTC, $2.47M) triggered narrative volatility. On the chain level, Solana USDT reversed −13.3% (wiping the prior session's +7.97%), while Hyperliquid USDC grew +$113.1M for the fourth consecutive day — the only sustained liquidity inflow signal in the current environment.

Stablecoin Liquidity
June 4, 2026 · 9:32 PM
1 subscriptions · 18 items
Coverage window: Jun 3, 13:00 UTC → Jun 4, 13:00 UTC (~23.5 hours)
Day 8 of USDT's burn cycle lands at −$301.2M, easing from Day 7's −$460.7M but still firmly contractionary — the five-session cumulative since May 30 is now −$995.4M. 1 USDC's single positive session (+$250.2M on Jun 2→3) lasted exactly one day: today it drops −$113.3M. DAI continues its steady −$12M/day erosion. Big-3 combined: −$426.7M in 24 hours, −$2.52B over 7 days. 1
The stablecoin drain is running alongside a market-wide deleveraging: BTC crashed to $61,300 intraday (its lowest since February 2026), ETH fell to $1,775, and $1.76B in leveraged longs were liquidated in 24 hours — 87% of that $1.53B was long positions. 2 Strategy's first BTC sale in nearly four years (32 BTC, $2.47M) became the session's narrative flashpoint — though Citi analysts say ETF flows, not the sale, remain the real price driver. 3

Quick scan

Entity / chainDirection24h change7d change
USDT totalBurn ↓ (easing)−$301.2M (−0.16%)−$1.99B (−1.05%)
USDC totalBurn ↓ (bounce fails)−$113.3M (−0.15%)−$494.3M (−0.65%)
DAI totalBurn ↓ (steady)−$12.1M (−0.26%)−$34.5M (−0.75%)
Big-3 combinedContraction ↓−$426.7M−$2.52B
Solana USDTViolent reversal ↓↓−13.3% (~−$400M)All prior gains wiped
Hyperliquid USDCGrowth intact ↑+$113.1M (+1.73%)+$290.1M (+4.55%)
Polygon USDCReversal ↓−$35.3M (−1.70%)Influx reverses
Stellar USDCFading ↑+$4.3M (+1.63%)Down from +14.45% prior session
Aptos USDCDrain ↓ (Day 11+)−$1.5M (−1.13%)Below $130M
Base USDCInflow ↑+$60.4M (+1.45%)
XDC USDCSpike ↑+$24.2M (+38.5%)
BTCCrash ↓↓$63,586 (−4.65%)−12.56%
ETHDrop ↓↓$1,775 (−4.61%)−9.99%
Fear & GreedExtreme Fear12 (+1 from 11)4-day low: 11
BTC ETF (Jun 3)Outflow Day 16−$396.6M16-day cum. ~−$4.37B

Supply snapshot

Loading stats card…
USDT falls to $187.19B, down −$301.2M (−0.16%). 1 The daily pace has eased from Day 7's −$460.7M peak, but the five-session sequence from May 30 through Jun 4 reads: −$97.5M, −$110.9M, −$158.2M, −$327.5M (worst), −$301.2M — no day has been positive. Cumulative five-day loss: −$995.4M. USDT's price edged to $0.9988 (−0.12%), a marginal but visible soft depeg under sustained selling pressure.
USDC drops to $75.96B, −$113.3M (−0.15%). 1 Yesterday's +$250.2M one-session bounce evaporated immediately — the pattern (Jun 1→2: −$79.8M, Jun 2→3: +$250.2M, Jun 3→4: −$113.3M) looks like a one-day mean reversion, not a trend change. Seven-day delta: −$494.3M (−0.65%).
DAI falls to $4.574B, −$12.1M (−0.26%). 1 The pace is nearly identical to Day 7 (−$12.3M), suggesting a stable erosion rate of roughly $12M per day. Ethereum mainnet ($3.72B, 81.3% of DAI) accounts for essentially the entire contraction at −$12.4M; Polygon ($716M, 15.7%) contributed −$2.1M.

USDT chain flows: Solana violently reverses, Ethereum burn eases

The Day 8 easing in USDT's headline number masks a sharp chain-level rotation. Ethereum's drain slowed from −$659M (Day 7) to approximately −$151M (Day 8, −0.19%) — a structural relief valve. 1 Tron (−$143.6M, −0.16%) also shed at a measured pace. Both chains decelerated relative to the prior session.
The big story is Solana: USDT-Solana reversed −13.3% in 24 hours, from $3.01B to $2.61B — erasing the entire +7.97% (+$200M) gain that made Day 7 notable. 1 All of the prior week's counter-trend Solana inflow has been reclaimed. The session-over-session swing of roughly $600M on a single chain is the sharpest in the current cycle; USDC-Solana also dropped −$113.1M (−1.48%) in the same window, pointing to a broad Solana stablecoin exodus rather than an asset-specific rotation.
On the small-chain side, USDT-Plasma gained +3.87% and USDT-Arbitrum +1.18% — minor offsets that do not change the aggregate direction.

USDC chain flows: Hyperliquid holds, Polygon and Stellar reverse

Loading chart…
Hyperliquid L1 USDC: +$113.1M (+1.73%) — Day 4 of the growth streak, lifting the chain to $6.67B. 1 Hyperliquid ranks second by USDC balance behind Solana ($7.51B) but has been the only chain adding supply consistently over the past four sessions. The 7-day gain of +$290.1M (+4.55%) is the only sustained upward trend across any major chain in the current period. In a risk-off session where traders are pulling capital everywhere else, persistent inflows to Hyperliquid's perpetual DEX suggest some participants are adding margin to short positions rather than exiting the market entirely.
Base USDC: +$60.4M (+1.45%) and XDC USDC: +$24.2M (+38.5%) are secondary positive data points, though XDC's absolute base ($63M) makes the percentage move less signal-bearing. 1
Polygon USDC: −$35.3M (−1.70%) reverses the prior session's +$65.2M inflow in full. 1 The chain sits at $2.04B. Two consecutive sessions of opposite moves with similar magnitudes suggest the Polygon figure is driven by short-term settlement or bridge activity rather than directional accumulation.
Stellar USDC: +$4.3M (+1.63%) — still positive but dramatically slower than the prior session's +$33.3M (+14.45%). 1 The MoneyGram-related inflow effect from the MGUSD Stellar launch (Jun 2) appears to be fading within two sessions.
Aptos USDC: −$1.5M (−1.13%), now at $128.8M — the chain's 11th-plus consecutive session of decline and below the $130M level. 1

Market context: BTC at $61K, $1.76B liquidated, F&G 12

BTC 24H candlestick chart Jun 3–4 showing price decline from $66,839 open to $62,533 low
BTC 24-hour price action: open $66,839, 24H high $67,375, intraday low $62,533. 4
Loading stats card…
BTC fell to an intraday low of $61,300–$61,400 (Binance), its lowest since February 6, 2026, before recovering to the $63,000–$64,000 range by the data cut. 4 At $63,586, BTC is −49.54% from its October 2025 ATH of $126,173. The 7-day loss is −12.56%; the 4-week loss is approximately −22.7%.
ETH fell to $1,775 (−4.61%), the ETH/BTC ratio holding at 0.0279. 5 ETH is −64.11% from its August 2025 ATH of $4,946.
Fear & Greed sits at 12 (Extreme Fear), one point above yesterday's 2026 low of 11. 6 Four sessions ago (Jun 1) it was 29. The path since May 31: 28 → 29 → 23 → 11 → 12. RSI readings from TradingKey indicate oversold conditions, with miners approaching breakeven production costs near current prices. 7
The crash has multiple contributors that compound each other. Scott Melker (The Daily Wolf) summarized five concurrent catalysts: (1) AI capital rotation — Alphabet securing ~$800B in AI infrastructure funding, Anthropic and OpenAI preparing IPOs; (2) Mt. Gox moving 10,422 BTC ($739M) on-chain for the first time since March (Jun 2, block 952,072), creating distribution anxiety despite the funds not yet reaching any exchange order book; 8 (3) U.S.-Iran conflict escalating — the House passed a war powers resolution 215–208 limiting presidential war authority on Iran, while Iran struck Kuwait and U.S. bases; 9 (4) 16 consecutive ETF outflow days totaling ~$4.37B; and (5) $1.8B in 24-hour liquidations — the largest single-day wipe since February. 10
Scott Melker noted: "1.8 billion dollars liquidated in 24 hours. That's the most since February, which was when Bitcoin went down to 60k." 10
Of the $1.76B liquidated (with another source citing $1.12B–$1.53B depending on window definition), long positions accounted for approximately $949M–$1.53B and short positions for $169M–$257M — the market had been structurally long-heavy going into the selloff. 2 11 Whale holders (10–10,000 BTC) net sold approximately 25,000 BTC over the past week, per TradingKey's on-chain data. 7
Crypto derivatives open interest (OI) fell 8.5% to $111.4B. Deribit's $60,000-strike BTC put options carry nominal OI exceeding $1B, and BTC/ETH put skew has increased — the options market is pricing a further drop more heavily than a recovery. 12 SOL OI hit an all-time high while spot price fell — a pattern often associated with aggressive short accumulation. 12

BTC ETF: Day 16 outflow, IBIT accounts for 86%

June 3 confirmed BTC ETF outflow: −$396.6M — the 16th consecutive trading day of net outflows (since May 18). 13 BlackRock IBIT was responsible for −$342.3M, or 86.3% of the session total; Fidelity FBTC contributed −$54.3M. All other ETFs recorded zero net flow. Total BTC ETF assets have declined from a peak of $104.29B to $82.83B. June 4 data was unavailable at the time of this data cut (Farside showed placeholder dashes). 13
Citi analysts, reported by CoinDesk, estimate that spot BTC ETF flows explain roughly 45% of weekly BTC price moves. Their assessment of the current streak: the primary problem is a shortage of new buyers, not the Strategy sale. The bank expects sentiment to stay depressed as long as ETF flows remain negative and U.S. crypto market structure legislation faces headwinds. 3
CoinDesk separately reported that BTC, ETH, SOL, and XRP ETFs combined have bled $4.4B over 13 sessions, with only Hyperliquid's HYPE ETF recording positive net flows. 14

Strategy breaks "never sell" — 32 BTC at $77K, first sale since 2022

Strategy (formerly MicroStrategy) disclosed in a June 1 SEC 8-K filing that it sold 32 BTC between May 26 and May 31, 2026, at an average price of $77,135/BTC, totaling approximately $2.47M. 15 This is the first BTC sale since December 22, 2022 (when Strategy sold 704 BTC at $16,776). The stated reason: funding STRC Series A preferred stock dividend payments, a corporate finance operation disclosed in advance and confirmed as planned by Citi. 3
Strategy still holds 843,706 BTC, worth approximately $53.7B at current prices — the largest corporate BTC treasury globally. 16 Q1 2026 net loss was $12.5B; STRC preferred stock annual dividend obligation is $1.712B against $900M in cash. 16
Two quotes establish the poles of the debate. Michael Saylor (Strategy Executive Chairman), in a 2022 Bloomberg interview: "Never. No. We're not sellers. We're only acquiring and holding Bitcoin. That's our strategy." 17 On the Q1 2026 earnings call, Saylor said the company would "probably sell some Bitcoin to fund a dividend just to inoculate the market." 17 CEO Phong Le added: "We will sell Bitcoin when it's advantageous to the company." 17
On June 4, as BTC crashed toward $62,000, Saylor posted on X: "Capital markets are funding the AI buildout at historic scale: ~$400B over 6 months. Bitcoin ETFs have seen ~$4B of outflows since May 14, pressuring BTC. This is a capital rotation, not a Bitcoin impairment. Volatility creates opportunity." 18
Lance Roberts (Investing.com) wrote: "When the world's loudest Bitcoin maximalist breaks his promise, the cult of belief he built over four years may be crumbling." 17 Scott Melker framed the structural concern differently — STRC preferred stock is trading at $96.71, below its $100 par value: "It could be the case that the biggest buyer in the market who buys billions of dollars a month in Bitcoin every month, could be running out of dry powder." 10
The mechanics are concrete: STRC below par means Strategy cannot currently raise fresh capital at its intended cost through STRC at-the-market (ATM) equity issuance. Total obligations stand at $15.5B in preferred stock and $6.75B in convertible bonds ($22.2B combined); the BTC treasury covers these at approximately 2.5× at $63,000. 16 Polymarket puts the probability of a margin call before year-end 2026 at 5%. 10
The sale amount — $2.47M — is 0.004% of Strategy's BTC holdings. Financial materiality is near zero. The signal question is whether Strategy will treat BTC sales as a routine treasury management tool going forward. Citi's position: this sale changes nothing strategically. Oliver Koblizek (BitcoinTreasuries.net) suggested it reads more like deliberate market conditioning — "teaching the market what a controlled sale looks like before any larger sale becomes necessary." 16

Industry events

Mastercard stablecoin settlement goes live with 5 launch partners

Mastercard's June 3 announcement officially activates stablecoin card settlement across six regulated stablecoins (Circle USDC, Paxos PYUSD/USDG/USDP, Ripple RLUSD, SoFi SoFiUSD) on eight blockchains (Arbitrum, Base, Canton, Ethereum, Polygon, Solana, Tempo, XRPL). 19 First-batch U.S. and LatAm partners: ARQ (formerly DolarApp), CBW Bank, Cross River, Lead Bank, and Nuvei.
Raj Dhamodharan (Mastercard EVP, Blockchain and Digital Assets) said: "The next phase of stablecoin adoption is about real-world utility, especially in settlement, where timing and liquidity matter most." 19 The operational change adds intraday, weekend, and holiday settlement windows — addressing the weekend liquidity gap that has historically been a friction point for card-issuing banks.

Stripe/Visa/Mastercard/Coinbase reportedly forming stablecoin consortium

The Information reported on June 4 that Stripe, Visa, Mastercard, and Coinbase are planning to form a consortium to issue a new stablecoin, designed to comply with the GENIUS Act (the U.S. stablecoin regulatory framework currently moving through Congress) and challenge Tether and Circle's combined ~80% market share. 20 The report cites people familiar with the matter; no official announcement has been made. If confirmed, it would be the first major institutional consortium stablecoin initiative to explicitly frame itself around displacing Tether/Circle's duopoly.

Apyx apxUSD briefly depegs to $0.93 during crash

Apyx's apxUSD — a collateralized stablecoin backed by STRC (Strategy preferred stock) — briefly fell to $0.93 (−7% from $1.00) as BTC declined toward $63K. 21 Apyx described the depeg as expected behavior: overcollateralization, dividend mechanisms, and Morpho market liquidation caps are intended to buffer volatility. The protocol's characterization — "a feature, not a bug" — will be testable in future crash scenarios.

Gnosis Pay: Zodiac Delay Module root cause confirmed

Gnosis Pay's co-founder Martin Köppelmann confirmed the June 1 exploit — PeckShield flagged it the same day — targeted the Zodiac Delay Module, which manages queued transactions in user wallets. 22 Köppelmann stated: "Gnosis will cover all user losses," committing to full treasury-funded reimbursement for affected EURe and GNO balances. 22 An earlier tweet suggesting users withdraw funds was retracted when Köppelmann determined most users could not batch-withdraw due to technical constraints. The full loss amount remains under assessment. Any project using Zodiac Delay or Roles modules (v2 / v1.1.0) should review exposure at app.zodiac.eco.

Signal read

The stablecoin contraction is now compound, not singular. USDT is on Day 8 of a burn cycle with −$995.4M in five sessions; USDC's one-day bounce was absorbed immediately; DAI erodes at a consistent $12M/day. The Big-3 seven-day figure of −$2.52B aligns directionally with the BTC deleveraging narrative — stablecoins are leaving the system, not pooling on the sidelines. 1 The missing data point is where the capital goes: exchange inflow/outflow data (available via CryptoQuant or Glassnode) would distinguish between redemption exits and sideline accumulation; that data was not available in this window.
Solana's −13.3% USDT reversal closes the counter-trend chapter. The prior session's +7.97% (+$200M) gain was the only material positive signal in the multi-week USDT burn arc. It lasted one session. Solana USDC also dropped −$113.1M in the same window. The combined Solana stablecoin exodus in 24 hours exceeds $500M, erasing the accumulated signal of multiple prior sessions. 1
Hyperliquid USDC is the one sustained counter-signal. +$113.1M on Day 4, +$290.1M over 7 days — the platform is accumulating capital while every other major chain loses it. The interpretation that matters: are these deposits funding new short positions (bearish market signal) or long-term liquidity provision (neutral)? Neither is confirmable from supply data alone, but the directional persistence over four sessions is the only liquidity positive in the current landscape.
The ETF streak is the mechanical weight on the market. Sixteen consecutive outflow days, −$4.37B cumulative: Citi's estimate that ETF flows explain ~45% of weekly BTC price moves means this streak has been a consistent -$200M to -$400M daily drag. IBIT alone contributed −$342.3M on June 3 — BlackRock's institutional client base is the primary redemption source. When that flow reverses, the mechanical support re-engages. When it doesn't, $60,000 is the next technical level being actively hedged in the options market ($1B+ in $60K puts on Deribit). 12
Strategy's 32-BTC sale is a policy signal, not a financial event. The $2.47M is a rounding error against an $843,706 BTC position. The signal is that Strategy now treats BTC as a liquid treasury tool, not a held-to-maturity position. That is what the market is pricing — not the $2.47M. Watching STRC's par recovery (currently $96.71 vs. $100) is more informative than watching the BTC amount: STRC above par means Strategy's ATM machinery is back online for further purchases; below par means the buy-side mechanism is constrained.
Institutional infrastructure is expanding into the drawdown. Mastercard's live stablecoin settlement is a concrete operational deployment, not a roadmap slide. The Stripe/Visa/Mastercard/Coinbase consortium report — if confirmed — would represent the most direct institutional challenge to Tether and Circle's market position since the stablecoin market took its current shape. These developments are on a multi-quarter timeline and do not change current supply dynamics, but they establish the demand foundation that USDC's on-chain supply contraction is currently working against.

Supply data: DeFiLlama Stablecoins API (~13:00 UTC Jun 4). BTC/ETH prices: CoinPaprika (~13:10 UTC Jun 4). Fear & Greed: Alternative.me API. BTC ETF data: Farside Investors (Jun 3 confirmed; Jun 4 not yet published). Liquidation figures from multiple sources — CoinDesk, Bitcoin.com, Incrypted — with variance noted in text. Mt. Gox movement: Bitcoin Magazine (Jun 2 block 952,072). Strategy sale: SEC 8-K filing via GuruFocus, BitcoinTreasuries.net.

Add more perspectives or context around this Post.

  • Sign in to comment.