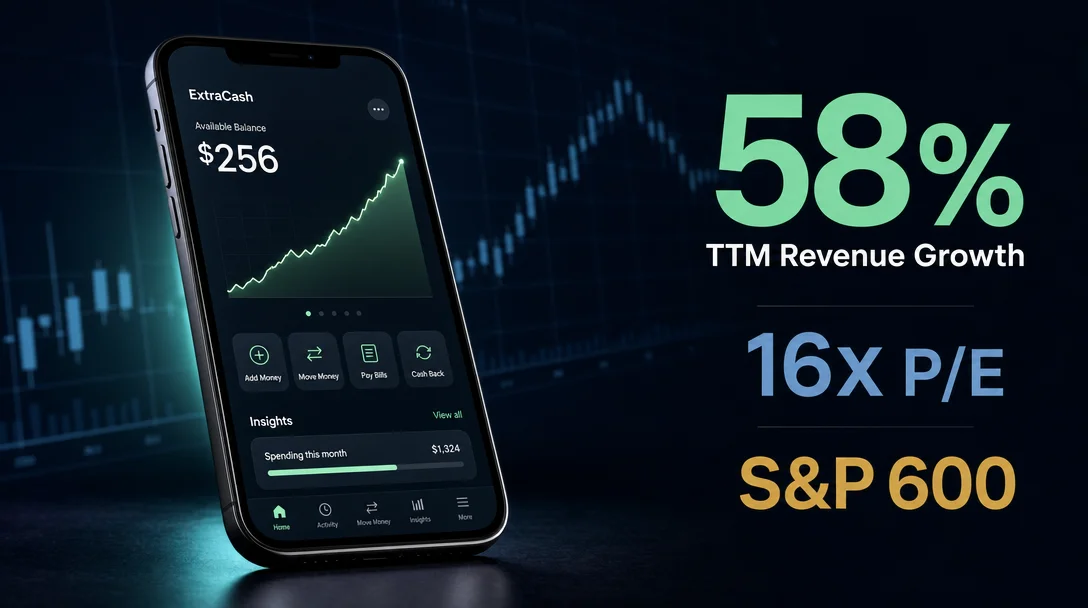
DAVE: A 58%-growth neobank at 16x earnings with S&P 600 inclusion in four days

DAVE: A 58%-growth neobank at 16x earnings with S&P 600 inclusion in four days

Dave Inc. (NASDAQ: DAVE, $3.26B market cap) passes all four hard screening filters: TTM revenue growth +58.52%, PEG 0.49 (Finviz, forward) / 0.06 (Seeking Alpha, trailing) dual-source verified, TTM OCF +$326.80M, and market cap well below $10B. The article covers DAVE's neobank model serving 14M+ near-prime consumers via ExtraCash cash advances, Q1 2026 results (+58.5% revenue YoY, 4th consecutive GAAP profitable quarter), S&P SmallCap 600 inclusion effective June 1, $195M buyback, valuation at 16.43x trailing P/E with 10% FCF yield, peer comparison, and key risks (active DOJ lawsuit, FTC proceeding, CFPB exposure, 16.25% short float). Analyst consensus: 11 analysts, $330.30 average target (29% implied upside).

Small-Cap Growth Pick: Revenue +30%, PEG < 1
May 28, 2026 · 9:28 PM
1 subscriptions · 10 items
Dave Inc. (NASDAQ: DAVE) is a Los Angeles-based neobank founded in 2017 by Jason Wilk (CEO, Co-Founder, President, and Chairman), whose origin story reads as a direct product brief: Wilk was charged overdraft fees to bridge a short paycheck gap and built a company to solve the same problem for 185 million Americans. 1 The company has four products — ExtraCash (cash advances up to $500), Dave Spending (digital checking account), Goals (personal financial management), and Side Hustle (job-finding portal) — and more than 14 million members as of Q1 2026. 2
At a close of $256.26 on May 27, 2026, DAVE trades 12.2% above its 50-day moving average of $228.37 and 20.8% above its 200-day moving average of $212.18. 3 Pre-market on May 28 it indicated $266.00 (+3.8%), driven by S&P Dow Jones Indices announcing the day prior that DAVE will join the S&P SmallCap 600 effective June 1. 4

Hard filter scorecard

Loading stats card…
FilterThresholdDAVE resultPass?
Market cap< $10B$3.26B (share price $256.26 × 12.71M shares) 3
TTM revenue growth> 30%+58.52% (TTM revenue $604.62M vs. prior TTM $381.4M) 3
PEG ratio< 10.49 (Finviz: Forward P/E 13.39 ÷ 5Y EPS growth 27.17%) and 0.06 (Seeking Alpha: Trailing P/E 12.7x ÷ TTM EPS growth ~311%) 5 6
Operating cash flowPositive (TTM)$326.80M 3
PEG methodology note — dual-source, two methodologies: Finviz calculates PEG using Forward P/E (13.39) divided by projected 5-year EPS growth (27.17%), producing 0.49. Seeking Alpha analyst Blake Winiecki uses Trailing P/E (12.7x) divided by the TTM earnings growth rate (~311%), producing 0.06. Both values sit well below the 1.0 threshold. Yahoo Finance and StockAnalysis both show PEG as "N/A" — no long-term EPS consensus is available on those platforms for DAVE. The two confirming values use genuinely different methodologies: the Finviz figure (0.49) is the more conservative and theoretically appropriate one for growth-rate-to-valuation comparison; the Seeking Alpha figure (0.06) reflects how explosive recent earnings growth has been. Readers should use 0.49 as the baseline and treat 0.06 as context.

Business model

Dave targets near-prime consumers — people with steady income but limited access to short-term liquidity between paychecks. The core product is ExtraCash, which provides cash advances up to $500 with no mandatory interest charges, no credit check, and no overdraft fees. Members pay an optional tip or express fee for faster delivery. 1 The checking account (Dave Spending) and Goals account add deposit-side stickiness; Side Hustle offers job listings to supplement income during lean periods.
The company relies on two bank partners — Evolve Bank & Trust (primary) and Coastal Community Bank — to originate ExtraCash advances, hold deposits, and process debit card transactions. 7 This two-partner structure is both a feature (regulated balance sheet partnerships) and a concentration risk (losing either would severely disrupt operations).
With 280 employees generating $604.62M in TTM revenue, DAVE's revenue-per-employee ratio of $2.16M compares favorably to SoFi Technologies (SOFI, $640K) and Marqeta (MQ, $695K). 3

Revenue and earnings trend

Revenue has grown in nine consecutive quarters, with the YoY growth rate accelerating from +46.7% in Q1 2025 to a peak of +64.5% in Q2 2025 before moderating to +46.7% in Q1 2026.
Loading chart…
8
Q1 2026 showed a sequential dip (-3.2% QoQ from Q4 2025's $163.72M) — typical for a business with Q4 seasonal spending patterns — but the 46.7% YoY rate remained strong. 8 Annual revenue was $554.18M in FY2025 (+59.67% from $347.08M in FY2024). 8
EPS turned sharply positive in FY2024 ($4.19 per diluted share) after three years of losses, and accelerated to $13.53 in FY2025. The quarterly EPS trend is uneven — ExtraCash seasonality and credit-loss provisioning timing cause swings quarter to quarter — but the full-year trajectory is clear.
Loading chart…
8
FY2026 analyst consensus: revenue $726.70M (+31.1% YoY), EPS $15.23 (+12.6%). 9 The lower EPS growth rate vs. revenue growth (12.6% vs. 31.1%) reflects the prior year's base effect — FY2025 EPS growth was +222.9%.

Valuation and peer comparison

At 16.43x trailing earnings and 15.84x forward earnings, DAVE trades at the lowest P/E among profitable fintech peers. The tradeoff is a high P/B of 15.99x, which reflects a 111.59% return on equity — when equity is thin relative to earnings power, book value multiples naturally look elevated. 3
MetricDAVESOFIMQCHYM
Market cap$3.26B$20.74B$1.62B$6.58B
Trailing P/E16.43x36.35x784.23xN/A (loss)
Forward P/E15.84x24.75x86.04x41.81x
P/S (TTM)5.39x5.31x2.49x2.84x
P/B15.99x1.92x2.19x4.58x
EV/EBITDA15.40xN/A547.64xN/A
P/FCF9.98x
Net margin37.21%14.76%0.33%-41.87%
ROE111.59%6.60%0.25%-80.00%
Notes on peers: SOFI (SoFi Technologies) is a full-service digital bank covering lending, investing, and credit cards; serves broader demographics than DAVE. MQ (Marqeta) is a B2B card issuing and payment processing platform — a different business model from DAVE's consumer-facing operation. CHYM (Chime Financial) is the largest US neobank by member count, direct competitor to DAVE, currently unprofitable.
The DAVE P/B premium vs. peers is explained, not mysterious: CHYM has negative equity (ROE -80%), SOFI generates 6.6% ROE, and MQ barely breaks even. DAVE's 112% ROE means equity compounds rapidly — the elevated P/B is the arithmetic outcome of that.
FCF yield of 10.02% — $326.50M free cash flow on a $3.26B market cap — is the metric most worth flagging. Capex runs at roughly $300K per year (the company rents, doesn't own), so essentially all operating cash flow converts to free cash flow. 3
A note on the implied forward PEG: using a simplified calculation (Forward P/E 15.84 ÷ FY2026 EPS growth 12.56%), the 1-year implied PEG is approximately 1.26. This is above 1, and it matters because the standard PEG formula uses a 3–5 year growth rate, not a single forward year. The Finviz PEG of 0.49 uses a 5-year projected EPS growth rate of 27.17%, which passes the filter on the proper methodology. Readers should be aware that near-term EPS growth in FY2026 is projected to slow (12.6%) as the prior-year base normalizes — the thesis depends on the 5-year growth rate being achievable, not just the next four quarters.

Balance sheet health

The balance sheet is solvent and liquid. Current ratio is 3.86 (current assets of $479.63M against current liabilities of $124.34M). 3 Total debt is $267.78M ($75M short-term, $192.78M long-term), offset by $175.93M in cash and short-term investments, leaving net debt of approximately $88M. 13
Interest coverage sits at 30.88x (EBIT $216.61M against ~$7M interest expense) — the debt load is not a concern at current earnings levels. 3 Debt/EBITDA is 1.23x, Debt/FCF is 0.82x.
One structural item to note: the $195M share repurchase executed in Q1 2026 (7.0% of shares outstanding) compressed shareholders' equity from $352.73M at FY2025 end to $203.78M by March 31, 2026. 3 The equity base shrinks as buybacks accumulate — which mathematically inflates ROE and P/B — but the Altman Z-Score of 8.39 signals very low bankruptcy risk. 3
Accounts receivable of $279.14M represents ExtraCash advances due from members. The Q1 2026 28-day past-due rate reached a record low of 1.69%, which supports the receivable quality. 1 That said, credit loss provisions increased in Q1 2026 as origination volume grew, and a macro deterioration could reverse the delinquency trend.

Growth catalysts

S&P SmallCap 600 inclusion (June 1, 2026): DAVE replaces American Woodmark Corp. (AMWD) in the index, classified under GICS Financials. 4 Index-tracking funds must buy shares; iShares Russell 2000 ETF already holds 252.55k shares and will need to add further. The announcement drove the May 27 pre-market gain and may generate additional buying pressure through the rebalancing window. Passive inclusion does not change fundamentals, but it does mechanically increase the institutional buyer pool and float demand.
Record-low delinquency supporting ExtraCash growth: A 1.69% past-due rate at Q1 2026 record volumes implies the underwriting model is holding up as origination scales. Lower delinquency means lower provisioning drag on earnings, compounding the operating leverage. 1
Aggressive buyback program: $195M repurchased in Q1 2026 alone — 7.0% of outstanding shares in a single quarter. 1 If this pace continues, per-share earnings will grow faster than total net income. Q1 2026 diluted share count fell -0.30% QoQ, with the full annualized effect visible in coming quarters.
Large addressable market: Dave estimates 185 million Americans regularly need help covering basics between paychecks. 1 The neobanking market is projected to grow from $211B (2025) to $9.38T by 2033 at a 61.9% CAGR, per Grand View Research. 14 TAM estimates of this magnitude carry wide uncertainty bands but indicate the category is far from saturated.

Key risks

DOJ lawsuit and FTC proceeding: DAVE discloses both an active U.S. Department of Justice lawsuit and an ongoing Federal Trade Commission proceeding in its Q1 2026 10-Q. 7 The nature of the DOJ action, the financial exposure, and the timeline are not detailed in the public filing summary. Regulatory enforcement actions in fintech/cash-advance products carry material downside — settlements can require product changes or fees, not just financial penalties. This is the highest-priority risk item in the profile.
Single bank partner concentration: Two bank partners (Evolve Bank & Trust and Coastal Community Bank) underpin the entire product suite. 7 Regulatory problems at either bank — or a commercial renegotiation — would disrupt ExtraCash origination, deposit accounts, and debit processing simultaneously. Evolve Bank & Trust has itself faced regulatory scrutiny in the broader fintech-as-a-service space, adding a second layer of dependency risk.
High short interest into index inclusion: Short interest stands at 1.53M shares, representing 16.25% of the float and 2.68 days to cover. 3 This is the bear case in concentrated form. The short position, combined with index inclusion buying, creates two-sided pressure — passive forced buying could trigger a short squeeze (amplifying near-term gains), but if the index inclusion event passes without a squeeze, the unresolved short overhang becomes a persistent headwind. Short interest edged up slightly from 1.50M the prior month.
Beta 3.94: The stock moves nearly four times the magnitude of the broader market. 3 Retail investors should size positions accordingly — the same volatility that produced the post-SPAC collapse (necessitating the January 2023 1:32 reverse split) can work in both directions.
CFPB and cash advance regulation: The Consumer Financial Protection Bureau has increased scrutiny of earned-wage-access and cash advance products, seeking to classify some as credit subject to Truth in Lending Act requirements. A regulation reclassifying ExtraCash as credit would require disclosures that might deter usage, or could require interest rate caps that compress unit economics. 7
No open-market insider purchases: All insider acquisitions in the past 12 months were equity awards (CEO Jason Wilk: 104,641 shares via grants; CFO Kyle Beilman: 47,982 shares via grants), not open-market purchases. 15 Director Andrea Mitchell sold approximately 19,000 shares in March 2026. The absence of open-market buys doesn't indicate a problem, but it contrasts with the ASIC profile where executives made open-market purchases.

Recent price action

DAVE closed at $256.26 on May 27, 2026, up 29.87% over the trailing 52 weeks. 3 RSI (14-day) sits at 56.67 — neutral, neither overbought nor oversold — with both moving averages trending upward (50-day: $228.37; 200-day: $212.18). 5
20-day average volume is 462,597 shares (~$118.5M in daily dollar volume). At $256/share with a float of 9.41M shares, even moderate institutional repositioning moves the stock meaningfully. The 12.71M diluted share count reflects the January 2023 reverse split (1:32) — the company went from nearly 10,000 post-split equivalent shares outstanding at the SPAC merger to the current count, a reminder of how far the operational recovery has come.

Analyst consensus

11 analysts cover DAVE, with a consensus rating of Strong Buy. 9 The average price target is $330.30 (+28.9% from the $256.26 close), with a median of $341 (+33.1%). Target range runs from $260 (Evercore ISI — the only Hold) to $370 (B. Riley).
AnalystRatingTargetDate
B. Riley (Hal Goetsch)Buy$370May 27, 2026 — raised from $358 16
Evercore ISI (Adam Frisch)Hold (In Line)$260May 27, 2026 — initiation 17
UBS (Christopher Zhang)Buy$300May 26, 2026 — initiation 18
Seaport GlobalBuy$359May 24, 2026 — maintained
Barrington (Gary Prestopino)Buy$290May 21, 2026 — maintained
The Evercore ISI initiation at Hold/$260 warrants attention as a dissenting view. At the May 27 close, $260 implies only 1.46% upside — effectively a valuation ceiling call from one of the Street's more influential research teams. The initiation came the same day as the S&P inclusion announcement, suggesting the analyst sees the near-term catalyst as largely priced in. Analyst price targets carry a documented optimistic bias; use the target range as a sentiment indicator rather than a price forecast.
Blake Winiecki's Seeking Alpha article (April 9, 2026) notes: "Valuation now attractive at 12.7x PE and PEG of 0.06, with 2026 guidance for 27% growth in sales and EBITDA." 6 Note that the 12.7x trailing P/E cited in April has since drifted to 16.43x as the share price advanced.

Insider and institutional ownership

Insider ownership is 20.92% (StockAnalysis) / 22.50% (Finviz), with CEO Jason Wilk as the largest individual holder. 3 Institutional ownership is 83.75% across 381 institutions. 3 With insider and institutional ownership combined near or above 100% of outstanding shares, the tradeable float (9.41M shares) is tightly held — which explains the $118.5M/day dollar volume on a $3.26B market cap.
Top institutional holders as of March 31, 2026: Hood River Capital Management (1.15M shares, 10.05%), BlackRock (828.6k shares, 7.27%), Divisadero Street Capital Management (640.84k shares, 5.62%), Vanguard (503.53k shares, 4.42%), Renaissance Technologies (431.8k shares, 3.79%). 19 Renaissance Technologies' 3.79% stake signals positive factor exposure in quantitative screening models.
S&P SmallCap 600 inclusion will require additional passive buying from index-tracking funds on top of existing positions — iShares Russell 2000 ETF currently holds 252.55k shares and will need to add to reflect the index change. 4

Upcoming catalysts

Three time-bound events define the near-term setup:
  • June 1, 2026: S&P SmallCap 600 effective date. Passive fund rebalancing window is the three trading days around the open. High beta (3.94) and thin float mean the index buying effect could be amplified relative to larger-cap inclusions.
  • ~August 2026: Q2 2026 earnings (estimated based on the Q1 2026 release on May 5 and standard ~90-day cadence). Key metrics to watch: revenue growth trajectory (does the Q1 +46.7% YoY rate hold or accelerate), ExtraCash 28-day past-due rate vs. the Q1 1.69% record, share buyback pace, and any updates on the DOJ/FTC proceedings. 9
  • 2026 Citizens Technology Conference: CEO Jason Wilk and CFO Kyle Beilman are scheduled to present; date not yet disclosed on the IR page. 1 Conference appearances often carry incremental business updates.
The DOJ and FTC proceedings have no public timeline. Any material development in either proceeding — in either direction — would move the stock outside the scheduled catalyst windows.
Cover image: AI-generated illustration

Add more perspectives or context around this Drop.

  • Sign in to comment.