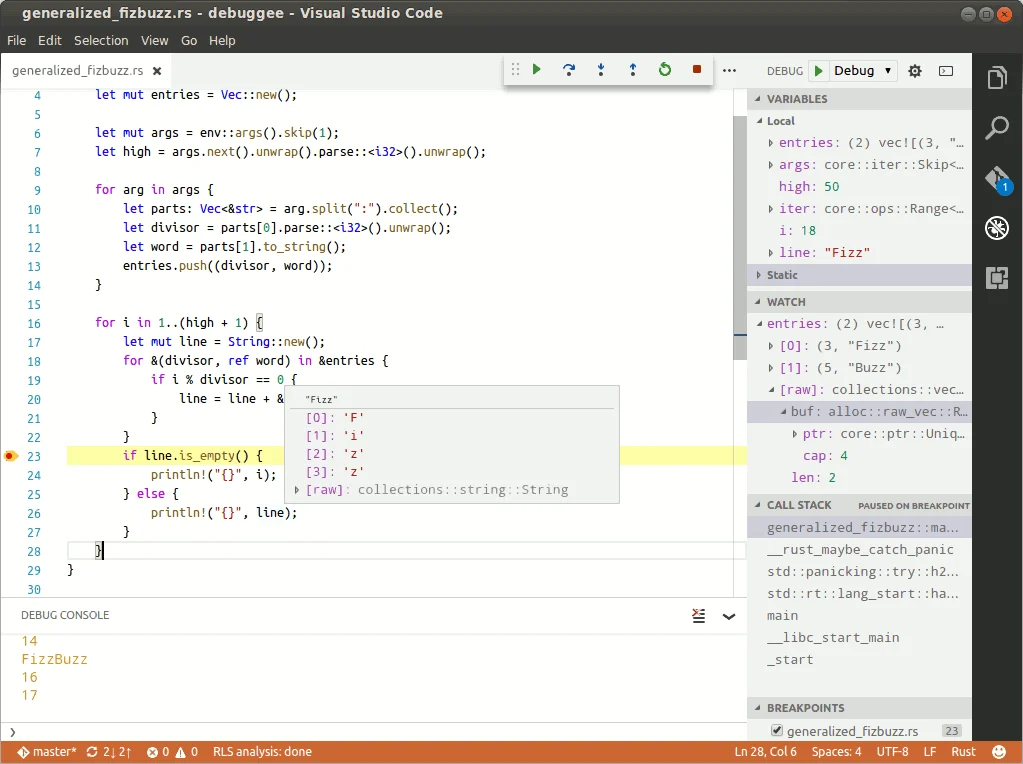
CodeLLDB — the Rust debugger VS Code doesn't ship with
CodeLLDB v1.12.2: the only native Rust debugger for VS Code on macOS/Linux.

rust-analyzer gives you completions, go-to-definition, and inline type hints. It doesn't give you a debugger. CodeLLDB (vadimcn.vscode-lldb) is the missing half: 10.4 million installs 1, a 4.93/5 rating, and the only practical native-debug path for Rust on macOS and Linux via VS Code.What CodeLLDB actually does that rust-analyzer doesn't
rust-analyzer's debug support is a UI shim — it puts a "Debug" CodeLens above
fn main() and test functions, but it requires an external debugger extension to do any real work. 2 On macOS and Linux that external extension is CodeLLDB. Without it, clicking "Debug" opens a VS Code Marketplace notification rather than a debug session.CodeLLDB bundles LLDB v21.1 — no system LLDB installation required. 3 The key capabilities it adds on top of the bare minimum:
| Capability | What you get |
|---|---|
| Cargo integration | cargo property in launch.json — auto-builds the right binary and locates it; cargo test targets work without manual path hunting |
| Rust type visualizers | Vec<T>, String, HashMap<K,V>, BTreeMap<K,V> displayed as readable values in the Variables panel (auto-loaded from Rust toolchain's sysroot) |
| Conditional breakpoints | Three expression evaluators: Simple (default), Python (/py prefix), Native LLDB (/nat prefix) |
| Data breakpoints (watchpoints) | Right-click any variable → "Break When Value Changes" — hardware-backed, up to 4 on x86_64 |
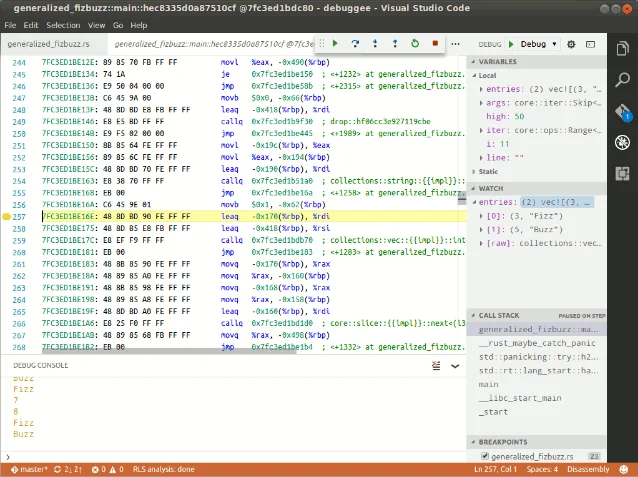
| Disassembly view | Auto-activates when execution enters code without debug info; instruction-level stepping |
| Python scripting API | codelldb module with evaluate(), create_webview(), start_debugging() — build custom visualizers |
| Regex breakpoints | Prefix /re on a function breakpoint sets it on all matching function names at once |
| Remote debugging | lldb-server platform mode and gdbserver protocol for embedded or remote targets |
Setting up a Rust project in three steps
Step 1 — Generate configs automatically. Open the Command Palette (
Ctrl+Shift+P) and run "CodeLLDB: Generate Cargo Launch Configurations". CodeLLDB reads your Cargo.toml and writes a launch.json covering every binary, example, and test target. 3Step 2 — Or write one manually for a specific Cargo target. The
cargo property replaces program and handles the build:// .vscode/launch.json
{
"version": "0.2.0",
"configurations": [
{
"type": "lldb",
"request": "launch",
"name": "Debug unit tests",
"cargo": {
"args": ["test", "--lib", "--", "--test-threads=1"],
"env": { "RUST_BACKTRACE": "1" }
},
"args": [],
"sourceLanguages": ["rust"]
}
]
}The
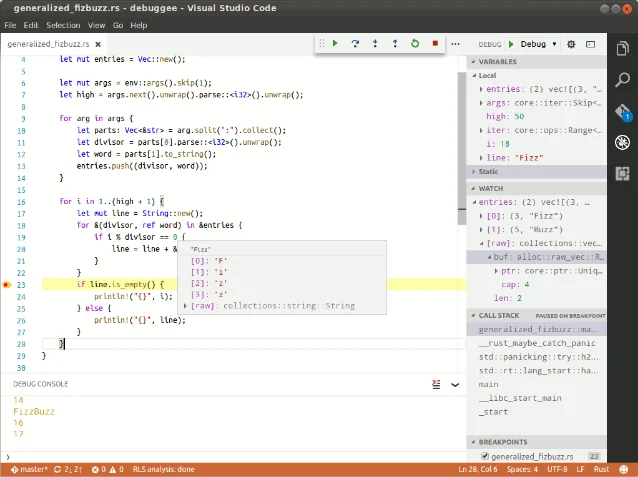
"sourceLanguages": ["rust"] line is required to activate Rust-specific type formatters. 3 Skip it and Vec<String> renders as a raw struct instead of a readable list.Step 3 — Hit F5. The extension builds the target, launches LLDB, and attaches the VS Code debug UI. Set breakpoints with F9, step with F10/F11, and inspect variables in the panel.
Conditional breakpoints and the Python evaluator
For tighter control, right-click any breakpoint and add a condition. The simple evaluator handles most cases:
// break only when the loop counter is a multiple of 50
i % 50 == 0

// break when a specific key exists in a HashMap
/py "error_code" in [k for k in $map.keys()]
The
/py prefix switches to full Python syntax with $variable substitution. The Debug Console also accepts LLDB commands directly; prefix with ? to evaluate an expression inline (?my_vec.len()). 3Disassembly view for when debug info runs out
When execution steps into a compiled dependency or a release build, CodeLLDB automatically switches to disassembly view. 3 Stepping in this mode moves one instruction at a time rather than one source line.
Install and compatibility
Loading content card…
Version: v1.12.2 (released 2026-04-21) 4
Publisher: Vadim Chugunov (
vadimcn), verified publisher 1
License: MIT
VS Code requirement: 1.61.0 or later 5
Host platforms: Linux (glibc 2.18+, x86_64 / aarch64 / armhf), macOS (10.12+ x86_64, 11.0+ arm64), Windows 10/11 x86_64 3
Primary languages: Rust and C/C++; also supports Ada, Fortran, Kotlin Native, Nim, Objective-C, Swift, Zig 6Known limitations
A few issues worth knowing before you depend on CodeLLDB in specific environments:
- Windows MSVC toolchain: incomplete Rust enum decoding. The default Windows Rust toolchain (
x86_64-pc-windows-msvc) uses PDB debug info. LLDB's PDB support is less complete than DWARF and can trigger debugger crashes. vadimcn recommends the GNU ABI toolchain (x86_64-pc-windows-gnu) for the best Windows experience — "using DWARF (and therefore, the GNU ABI) is recommended whenever possible." 7 The MSVC toolchain also fails to fully decode Rust enums. 7 - Android debugging broken since v1.12.0. An open issue (#1388, filed April 2026) reports SIGSEGV crashes when attaching to ARMv8 Android targets, caused by missing LZMA support for
.gnu_debugdatasections. No fix has shipped. 8 - Complex nested Rust structs show partial info. When expanding deeply nested types like
SharedStateorArc<Mutex<HashMap<...>>>, the Variables panel may show only a[raw]pointer wrapper rather than the struct's contents. An open issue (#1361) labels this as a formatter bug. 9 - Expression evaluation can crash the debug adapter. LLDB has known bugs triggered by evaluating certain expressions — including automatically via mouse hover or Debug Console completion. If you hit adapter crashes, disable
lldb.evaluateForHoversandlldb.commandCompletionsin settings. 10 - No edit-and-continue or memory profiling. These are LLDB-level limitations, not CodeLLDB bugs. For heap analysis, reach for
valgrindorheaptrackseparately. 6 - Docker containers with ASLR disabled fail with
'A' packet returned an error: 8. Fix: add--security-opt seccomp=unconfinedto your container, or set"initCommands": ["set set target.disable-aslr false"]in your launch config. 11
Install it if you're writing Rust on macOS or Linux — there is no alternative native debugger for VS Code on those platforms. It also works well for C/C++ and any LLDB-compatible language. Skip it if you're on Windows MSVC and need to inspect Rust enums: switch to the GNU toolchain first, or use CLion/RustRover which use their own DWARF-aware debug backends.
Plugin: CodeLLDB · Publisher: Vadim Chugunov (
vadimcn), verified · Version: v1.12.2 · License: MIT
Languages: Rust, C/C++, Swift, and more · IDE: VS Code ^1.61.0 · Use case: native debugging via LLDB
Install: vadimcn.vscode-lldb on VS Code Marketplace · GitHubReferences
- 1CodeLLDB — Visual Studio Marketplace
- 2Rust in Visual Studio Code — Microsoft
- 3CodeLLDB MANUAL.md v1.12.2
- 4Release v1.12.2 — vadimcn/codelldb
- 5package.json v1.12.2
- 6CodeLLDB README v1.12.2
- 7CodeLLDB Wiki — Windows
- 8Issue #1388 — Android debug crash since 1.12.0
- 9Issue #1361 — Rust complex struct variable is not human readable
- 10CodeLLDB Wiki — Debugging problems
- 11CodeLLDB Wiki — Debugger startup problems
Add more perspectives or context around this Drop.