FIGR: blockchain-native loan marketplace, Rule of 140, one-source PEG

FIGR: blockchain-native loan marketplace, Rule of 140, one-source PEG

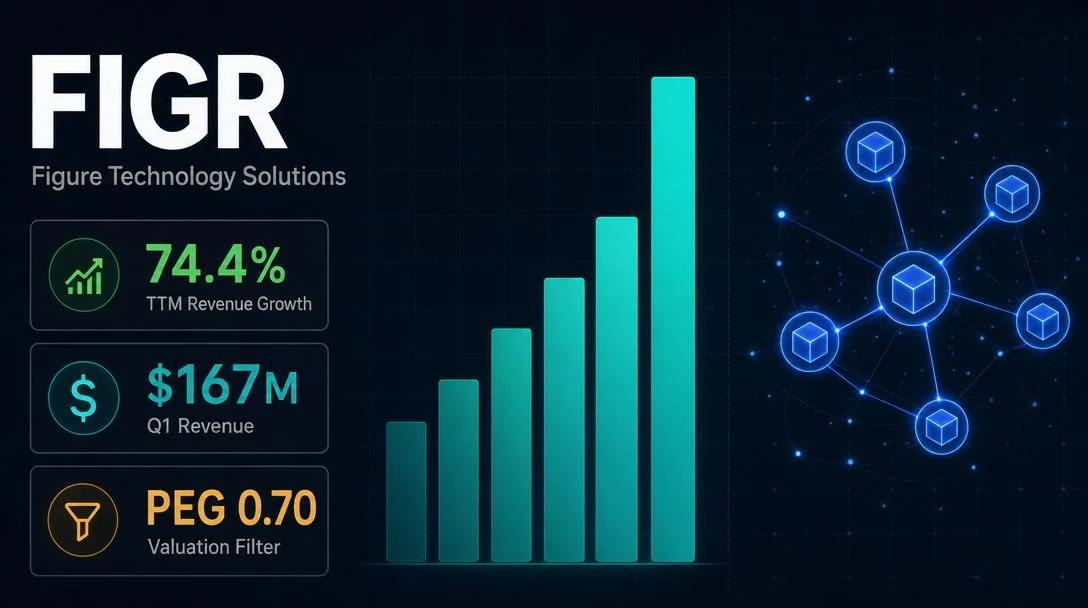
Figure Technology Solutions (NASDAQ: FIGR, $7.51B market cap) passes all four hard screening filters as of May 22–24, 2026: TTM revenue growth +74.38%, PEG 0.70 (single-source, disclosed), TTM OCF +$165.02M, market cap below $10B. The article covers FIGR's blockchain-native consumer lending marketplace (3.8% net take rate, near-100% gross margin, $1,000 vs. $11,500 industry origination cost), Q1 2026 earnings ($167M revenue +97.6% YoY, $45M net income, 49.6% adj. EBITDA margin — Rule of 140), Q2 volume guidance $3.8B–$4.1B, peer valuation vs. UPST/SOFI/LC, net cash balance sheet ($439M), catalysts (387 partners, Flagstar onboarding, first-lien 14%→20%, YLDS $598M, Credibly SMB partnership), and key risks (single-source PEG, SBC at 57.5% of net income, HELOC concentration, three 10b5-1 insider sales, material weaknesses). Analyst consensus: Strong Buy, 9 analysts, $54 average target (59% implied upside) vs. GuruFocus GF Score 23/100 and DCF fair value ~$15.38. Upcoming catalysts: Bernstein May 27, Piper Sandler June 3, FOMC June 16–17, Q2 earnings ~August.

Small-Cap Growth Pick: Revenue +30%, PEG < 1
May 24, 2026 · 9:30 PM
1 subscriptions · 10 items
Figure Technology Solutions (NASDAQ: FIGR) is today's pick. It passes all four hard screening filters with some of the widest margins this channel has seen. The wrinkle is equally wide on the other side: FIGR IPO'd roughly six months ago, its PEG of 0.70 comes from a single data vendor, and three executives sold stock in May under pre-arranged plans. That combination — fast growth, single-source valuation confirmation, recent-IPO opacity — is exactly the kind of setup that rewards investors who read the detail and punishes those who rely on the headline number.
Current price: $33.95 (May 22, 2026 close). 1

The screening verdict

Hard filterThresholdFIGR resultStatus
Market cap< $10B$7.51B (StockAnalysis); $7.50B (Yahoo Finance); $7.45B (iTick)✅ Pass
TTM revenue growth> 30%+74.38% (StockAnalysis, to $510.35M TTM)✅ Pass
PEG ratio< 1.00.70 (StockAnalysis only — Yahoo Finance does not publish PEG for FIGR)✅ Pass ⚠️
TTM operating cash flowPositive+$165.02M (StockAnalysis and Yahoo Finance, identical)✅ Pass
PEG caveat: StockAnalysis reports trailing P/E of 58.74x and derives PEG 0.70 from that figure divided by a consensus long-term EPS growth rate (SahmCapital cites ~52.3% forward EPS growth). Yahoo Finance does not publish a PEG for FIGR, citing insufficient trading history. No second independent source confirmed 0.70. The directional case still holds — a 58x trailing P/E on a 74%-TTM-growth business with expanding margins does not look expensive relative to growth — but investors should treat the PEG number as one vendor's estimate rather than a confirmed cross-source figure. 3

What Figure Technology Solutions does

Figure Technology Solutions (San Francisco; ~602 employees) operates a blockchain-native consumer lending marketplace. The core product is a home equity line of credit (HELOC) origination and distribution platform: borrowers apply through Figure or its 387 lender partners, loans are originated on Figure's proprietary blockchain (Provenance), and then sold into capital markets through Figure Connect — Figure's institutional distribution layer. 4
Revenue is primarily fee-based. The net take rate in Q1 2026 was 3.8% of loan volume (within management's 3.5%–4% guidance band). Because Figure does not hold loans on balance sheet — it originates and distributes — the gross margin runs near 100%, a structure the company describes as capital-light. Management has reframed FIGR as a capital markets company rather than a HELOC lender: Executive Chairman Michael Cagney said on the Q1 2026 earnings call, "Figure is not a HELOC company, Figure is a company building a capital market ecosystem native to blockchain." 5
The blockchain infrastructure is a real operational differentiator. Figure's average loan origination cost is approximately $1,000 per loan versus an industry average of $11,500, according to Miller Value Partners — a 91% cost advantage driven by automated underwriting, blockchain title processing, and straight-through-processing of loan transfers. 6 The most recent securitization received AAA ratings from both S&P and Moody's — the first blockchain-native financial instrument to receive that designation from both agencies simultaneously. 4

Revenue and earnings trend

Loading stats card…
Sources: 4 5
The five-quarter revenue trajectory is a near-vertical line interrupted by a modest Q4 2025 dip:
Loading chart…
Sources: 7 4
On an annual basis: FY2023 revenue was $161.4M → FY2024 $292.7M (+81.3%) → FY2025 $432.1M (+47.6%) → Q1 2026 alone was $167.0M, implying an annualized run rate above $600M. 7
The Q4 2025 dip from $138.5M to $135.6M was modest and reversed sharply in Q1 2026. CFO Minchung Kgil framed the combined growth-plus-margin picture on the Q1 call: "We are operating at a rule of 140 — 92% year-over-year adjusted net revenue growth combined with an adjusted EBITDA margin of 50%." 5 The traditional Rule of 40 threshold requires growth plus EBITDA margin to exceed 40%; FIGR's 142 composite is roughly 3.5x that benchmark.
Q2 2026 guidance: Consumer Loan Marketplace (CLM) volume of $3.8B–$4.1B, representing 31%–41% sequential growth from Q1's $2.9B. April 2026 operating data already showed CLM volume of $1.34B for the month (+108% YoY), on track for the guidance range. 8 Management expects the full-year effective tax rate to be approximately 20% — Q1's effective rate was distorted by a $6.9M tax benefit from IPO-related equity activity. 5

Valuation

At $33.95, FIGR's multiples reflect hyper-growth pricing with some important gaps in the data set:
MetricFIGRUPSTSOFILC
Market cap$7.51B$2.73B$20.04B$1.80B
TTM revenue growth+74.4%+57.7%+41.0%+25.4%
Trailing P/E58.74x69.00x35.11x10.44x
Forward P/E33.67x11.23x23.91x8.77x
PEG0.70 ⚠️0.280.63n/a
P/S (TTM)14.71x2.33x5.13x1.31x
EV/Sales13.85xn/a4.70xn/a
TTM OCF+$165M-$268M-$6.08B-$3.01B
UPST (Upstart Holdings, the AI-powered cloud lending platform) shows the richest growth after FIGR at 57.7% TTM, yet trades at only 2.33x P/S and has a PEG of 0.28 — partly reflecting UPST's history of severe growth volatility and negative OCF. SOFI (SoFi Technologies, the digital financial services platform combining lending, banking, and investing) trades at a lower forward P/E despite slower growth, benefiting from its bank charter and deposit funding. LC (LendingClub Corporation, the digital marketplace bank offering personal loans and auto refinance) is the value outlier at 10x trailing P/E, though its revenue growth at 25.4% falls below our 30% threshold.
The critical differentiator in this peer table: FIGR is the only one with positive TTM operating cash flow. The P/S of 14.71x is the highest in the group by a wide margin, which is only justifiable if the near-100% gross margin and the Rule of 140 trajectory continue. If revenue growth decelerates below 50% — the comps get harder from Q2 onward — the P/S premium compresses quickly.
EV/EBITDA note: StockAnalysis and Yahoo Finance both show EV/EBITDA as not available for FIGR in their statistics pages. The company's own Q1 adjusted EBITDA of $82.7M annualizes to approximately $330M; against the enterprise value of approximately $7.07B (market cap minus net cash of $439M), that implies a rough 21x forward EV/adj. EBITDA if Q1 margins hold — more reasonable than the headline P/S suggests. Treat this estimate with caution as it is not from a published source. 4
Loading link preview…

Balance sheet

FIGR holds a net cash position — unusual for a company at this growth stage:
ItemValue
Cash and equivalents (ex. restricted)$1.46B
Total debt$1.32B
Net cash+$439M ($1.99/share)
Current ratio1.90
Debt/Equity1.02
TTM operating cash flow+$165.02M
Share buyback authorization$200M (~2.7% of market cap)
The debt/equity of 1.02 looks elevated, but the $439M net cash position and $165M annual OCF generation make near-term liquidity concerns minimal. The $200M buyback authorization gives management a lever to offset some of the SBC dilution discussed below — Q1 balance sheet showed approximately $20M of shares repurchased against that program. 6
Loading link preview…

Growth catalysts

Partner network acceleration. FIGR added a record 80 new lending partners in Q1 2026, bringing the total to 387. The Q1 additions include Flagstar Bank (a top-35 U.S. bank by assets), expected to go live in Q2 2026 as the largest bank-type originator on the platform, and the sixth-largest mortgage originator in the U.S. by Bankrate.com ranking. 4 Mutual of Omaha (a Fortune 300 financial institution) increased its monthly volume 5x after upgrading to Figure Connect. 5 Management described the demand dynamic on the Q1 call: a major prospective partner told them Figure becoming the default capital market was the company's second-largest existential threat after AI. 5
First-lien market expansion. First-lien mortgage volume grew from 14% of total production in Q1 2025 to 20% in Q1 2026. Management is explicit that the first-lien opportunity is 25x larger than the second-lien (HELOC) market. The economics also improve at scale: a 2% take rate on a $300,000 first-lien loan generates $6,000 in fee revenue versus $2,400 on a typical $60,000 HELOC — for roughly the same origination cost. 5 Partner-branded loan volume has grown at a 95% CAGR since late 2023. 6
Blockchain ecosystem (YLDS, Democratized Prime, Figure Forge, OPEN). Four distinct blockchain products are in early-stage scaling:
  • $YLDS (yield-bearing stablecoin): $598M in circulation at Q1 2026 end. Figure earns SOFR plus 35 basis points on the spread. YLDS is the largest deployed real-world asset (RWA) in the DeFi ecosystem per DeFiLlama, and has expanded to Solana and Ethereum. 4
  • Democratized Prime: An on-chain lending marketplace where institutional lenders match against borrowers at a base rate of 50 basis points over benchmark. Q1 end matched offers: $368M. April end: $384M. 8 CEO Michael Tannenbaum said, "We see a medium-term world where Democratized Prime balances are measured in the tens to hundreds of billions." 5
  • Figure Forge: Fractionalizes whole loans into $1-denomination participation units, bridging real-world assets (RWA) to DeFi liquidity.
  • OPEN (On-Chain Public Equity Network): A blockchain-native equity issuance network. A second issuer, OpenWorld, filed a registration statement in Q1 2026. 4
SMB channel. FIGR announced a strategic partnership with Credibly (an SMB working-capital lender that has served 61,000 small businesses with $3B+ in capital) on May 5, 2026, effective Q2. 12 SMB channel volume hit approximately $60M in Q1, with DSCR (debt-service coverage ratio products) and RTL (rental transition loan) products growing 70% quarter-over-quarter. 5
Loading link preview…

Key risks

Single-source PEG (data risk). The 0.70 PEG is the screening filter that FIGR's investment case most depends on — and it is available from only one vendor (StockAnalysis). The exact forward EPS growth rate used to derive it is not disclosed. Investors who want to independently verify the PEG should cross-reference Morningstar, Finviz, or Zacks, or compute it manually from analyst consensus EPS growth estimates. Until a second independent source confirms it, the PEG must be treated as directionally supportive, not definitively confirmed.
SBC load and share count dilution. Stock-based compensation surged to $25.9M in Q1 2026 from $2.4M in Q1 2025 — a 10.7x increase primarily tied to IPO-related vesting events. 4 At 15.5% of Q1 revenue and 57.5% of Q1 net income, this SBC load is high. Total shares outstanding grew approximately 280% year-over-year from the IPO and associated offerings. 1 Management expects SBC to normalize as IPO vesting runs off, but no specific quarterly path was given. Per-share metrics improve considerably less than total-dollar metrics given the dilution.
HELOC concentration and material weaknesses. The majority of CLM volume remains in HELOC — home equity products are sensitive to housing prices, interest rate movements, and consumer credit conditions. A 100-basis-point rise in mortgage rates could meaningfully reduce origination appetite. The company also disclosed material weaknesses in internal controls in its 10-K (year ended December 31, 2025) that require ongoing remediation. 4 Management has argued the HELOC label is too narrow — "We don't actually consider the HELOC market to be relevant to what we do" — but the loan book composition says otherwise until first-lien and non-QM products meaningfully displace it. 5
Insider selling. Three executives sold stock in May 2026 under pre-arranged Rule 10b5-1 plans: Director and 10% owner June Ou's spousal account sold 35,190 shares (~$1.34M) on May 13; 13 CEO Michael Tannenbaum sold 2,031 shares ($73,177) on May 20; 14 Director Michael Cagney sold 10,105 shares (~$380K) on May 13. All three sales were under pre-set 10b5-1 plans (Tannenbaum's and Ou's were established in late 2025), which limits the signal value. Tannenbaum's sale represents 0.06% of his remaining 3.19M-share position. Zero insider purchases are on record in the past three months, per GuruFocus data. 15
Regulatory and rate exposure. Digital asset regulation remains uncertain, particularly for $YLDS and Democratized Prime, which operate at the intersection of lending and blockchain securities. The Consumer Financial Protection Bureau (CFPB) and state-level consumer lending laws apply to the core HELOC business. FIGR's blockchain ecosystem revenue is also tied to SOFR — $YLDS holders earn SOFR minus 35 basis points, meaning Figure's spread narrows if SOFR falls. The next Federal Open Market Committee (FOMC) rate decision is June 16–17, 2026.

Price action and analyst consensus

FIGR closed at $33.95 on May 22, 2026 — down 22.4% year-to-date from an estimated January 2 close of ~$43.74, and 56% below its 52-week high of $78.00 reached in mid-January during post-IPO euphoria. The 52-week low was $25.01, set in late February during a broad market selloff. Average daily volume over the trailing 20 days: 3.98M shares (5.19M over three months per Yahoo Finance). 1 2
Short interest stands at 10.87M shares — 4.92% of shares outstanding and 8.52% of float — with a days-to-cover of 2.77. 1 The RSI (14-day) was 41.96 as of the May 22 close, approaching but not in oversold territory. FIGR trades below both its 50-day moving average ($35.15) and 200-day moving average (~$40.11). No 5-year beta is available given the recent IPO.
Wall Street consensus as of May 24, 2026: Strong Buy across 9 analysts (Bernstein, BofA Global Research, Goldman Sachs, Mizuho, Jefferies, Piper Sandler, KBW, Needham, Autonomous Research). Average 12-month price target: $54.00 (Yahoo Finance), implying 59% upside from $33.95. Target range: high $75.00, low $33.00. 16 The $33.00 low target from BofA is barely above the current price — BofA raised its target from $31 to $33 on May 14. Mizuho (Dan Dolev) raised its target from $45 to $55 on the same date, maintaining Outperform, calling the results "excellent, very very strong." 5
Analyst price targets carry systematic optimism bias; treat these as directional signals, not forecasts.
GuruFocus assigned a GF Score of 23/100 and flagged the stock as overvalued on its own GF Value framework, estimating a DCF fair value near $15.38. 15 The GuruFocus methodology applies conservative normalized earnings multiples; for a company in hyper-growth mode with a capital-light model, it likely understates long-term earning power — but the divergence between GuruFocus and the Street consensus ($15 vs. $54) captures the full range of the debate.
Loading link preview…

Insider and institutional ownership

Insider ownership: approximately 29.6% (StockAnalysis). Institutional ownership: approximately 43.3%, with FMR LLC (Fidelity) the largest disclosed institutional holder at 1.28M Class A shares (7.2% of outstanding) as of a March 31, 2026 Schedule 13G filing. 1 Total shares outstanding: approximately 220M (181M Class A + 37.9M Class B + 688K Blockchain shares), with fully diluted Class A of approximately 249M including RSU and option conversions. 13
The three May insider sales are detailed in the risks section above. Post-sale, Director June Ou retains direct Class A holdings of 6.13M shares; CEO Tannenbaum retains 3.19M shares (approximately $108M at current price). The insider ownership figure of 29.6% reflects founders and early employees who participated in the IPO and subsequent vesting — the absolute dollar positions remain large even after trimming.

Upcoming catalysts

Three near-term dates and one macro event to track:
  • May 27, 2026 — Bernstein 42nd Annual Strategic Decisions Conference, New York (3:30 PM ET). Management presentation; livestream and replay at investors.figure.com. 17
  • June 3, 2026 — Piper Sandler Global Exchange & FinTech Conference, New York (2:00 PM ET). 17
  • May operating data — FIGR releases monthly CLM volume and ecosystem metrics. The May release will show whether April's $1.34B monthly run rate is tracking toward the $3.8B–$4.1B Q2 guidance.
  • FOMC June 16–17 — Rate expectations directly affect HELOC origination economics, $YLDS spread, and investor appetite for consumer credit assets.
  • Q2 2026 earnings — Expected in mid-August 2026 (inferred from Q1's May 11 release date; no official date confirmed). Three items to watch: (1) CLM volume against the $3.8B–$4.1B guidance, (2) whether Flagstar's ramp is visible in the partner data, and (3) SBC normalization progress.
Executive Chairman Michael Cagney set long-term timeline expectations at the Q1 call: "Our blockchain ecosystem is a multiyear endeavor with massive upside... It took us several years to drive meaningful traction in HELOC. We expect the same as we build into additional credit, equity, and yields." 5

Opportunity-risk structure

FIGR passes all four filters with margin. The investment case is specific on both sides.
The bull case rests on three things happening simultaneously: (1) Flagstar and the other Q1 2026 whale partners ramp to meaningful volume in Q2–Q3, keeping CLM volume on a trajectory toward management's "clear path to $2B monthly" target; 5 (2) first-lien mix shift continues, improving fee revenue per dollar of volume; (3) the blockchain ecosystem products (YLDS, Democratized Prime) grow their AUM to the point where they generate visible incremental revenue. If all three materialize, the forward P/E of 33.67x on 74%-TTM-growth looks defensible.
The bear case is that Q1 was an anomaly rather than a trend. The comparison base from Q2 2025 onward gets progressively harder — Q2 2025 already showed 32.5% YoY CLM growth, meaning FIGR needs to sustain absolute volume increases, not just percentage re-acceleration. The SBC load may not normalize as quickly as management suggests, given that IPO lock-up expirations and ongoing equity grants continue. And the single-source PEG is the filter that anchors the entire valuation thesis — if a second data vendor publishes a higher PEG (or no PEG), the screening case weakens.
The stock is at $33.95 — 56% below its January 2026 high and sitting below both moving averages. The lowest analyst target is $33. That asymmetry means the entry window is narrow: if the May 2026 operating data (due in early June) or the Bernstein conference appearance disappoints, the next technical level of meaningful support is the February 2026 low at $25.

Screening data as of May 22–24, 2026. Stock price as of May 22, 2026 close. All financial figures in USD. This article is research, not investment advice.

Add more perspectives or context around this Drop.

  • Sign in to comment.