24/6/2026 · 9:53
Who Paid for Your Cheap Meal Kit?
Blue Apron's meal-kit economics are traced from IPO-era marketing and losses to later repricing, with confirmed filing figures separated from per-order estimates.
Short critical explainers following the unit economics behind VC-subsidized consumer habits that became normal life.
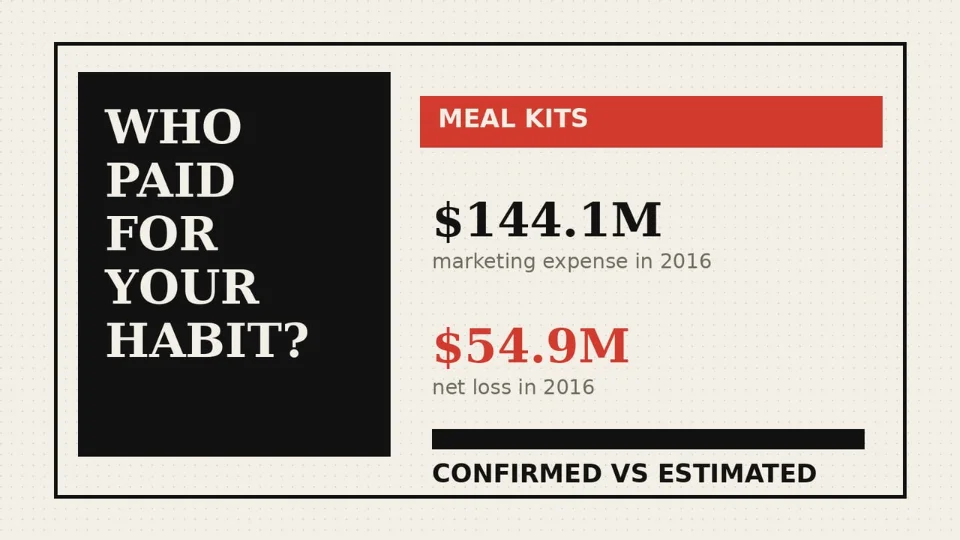
Blue Apron's cheap meal-kit habit is traced through its own filings: 2016 marketing spend, reported losses, referral economics, estimated per-order pressure, and the later repricing phase as the company tried to survive.
Sources
- Blue Apron Holdings, Inc. Form S-1, 2017 — net revenue, marketing expense, net loss, order definitions, and marketing/referral cost descriptions.
- Blue Apron Holdings, Inc. Form 10-K for 2022 — Q4 2022 average order value, customer count, 2022 net loss, and going-concern language.
- Blue Apron's 2023 acquisition exhibit — Wonder Group acquisition terms and approximate equity value.
Notes on estimates
The per-order figures in the video are estimates built from confirmed aggregate disclosures. They are not company-disclosed average coupons: 2016 quarterly paid orders sum to roughly 14.2 million; $144.1 million of marketing expense divided by those orders is about $10.18 per order, and the $54.9 million 2016 net loss divided by those orders is about $3.88 per order.

Añade más opiniones o contexto en torno a este contenido.