3/7/2026 · 6:38
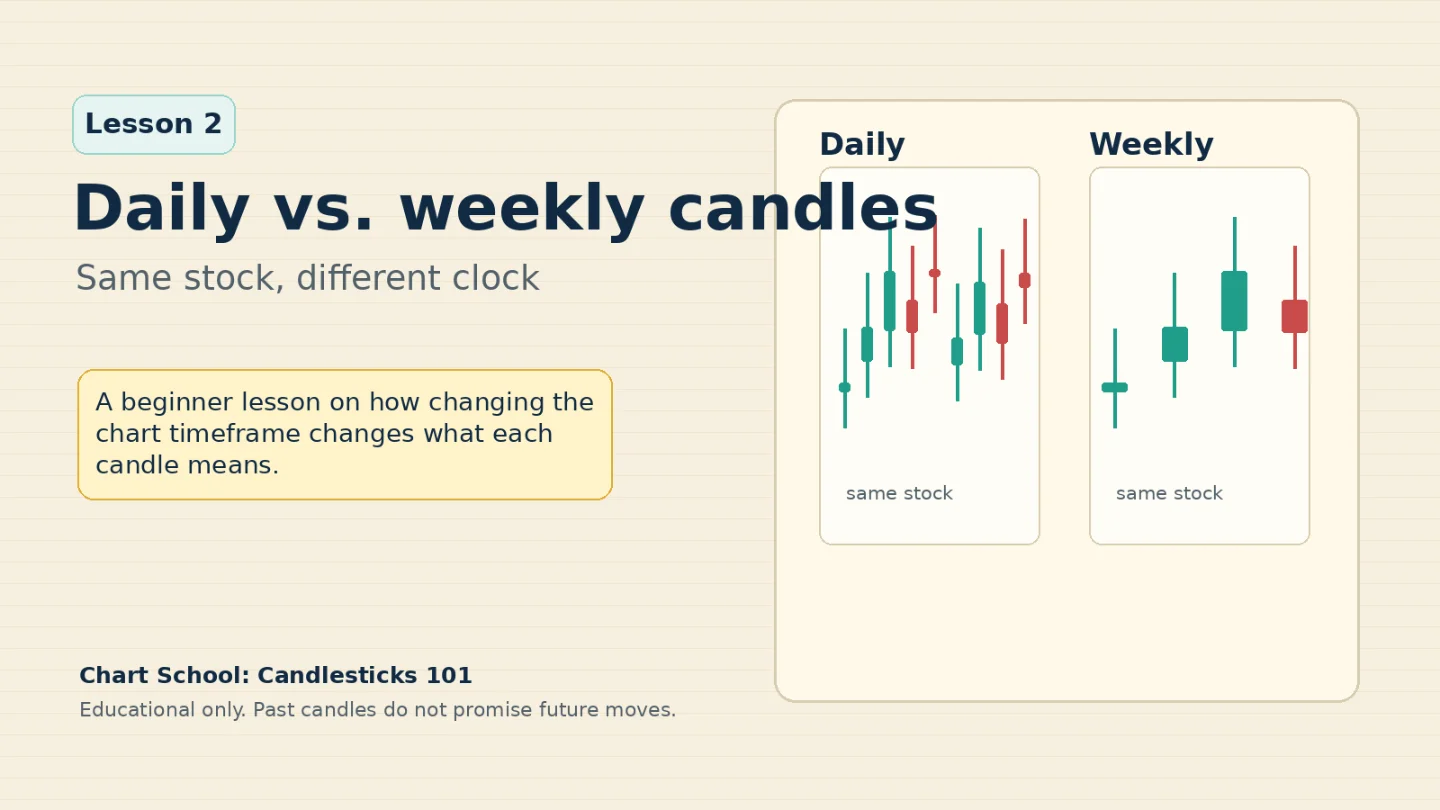
Lesson 2: Daily vs. weekly candles
A beginner-friendly lesson on how chart timeframes work, using a simple diagram and a real MSFT example to show why daily and weekly candles can tell different versions of the same stock's recent history.

The fastest way to get lost in a stock chart is to forget that the chart has a clock. A candle is not just a shape. It is a time bucket.
On a daily chart, one candle summarizes one trading day. On a weekly chart, one candle summarizes one trading week. The stock can be exactly the same, but the story looks different because each candle is collecting a different amount of time.
The chart has a clock
Schwab explains that a price chart visualizes trading activity during a single trading period, such as five minutes, 30 minutes, or one day. That period usually includes the open, high, low, and close prices for that slice of time. 1
That is the whole idea behind a timeframe: it tells you how much time one candle represents. If the timeframe is daily, the candle is a one-day summary. If the timeframe is weekly, the candle is a one-week summary.
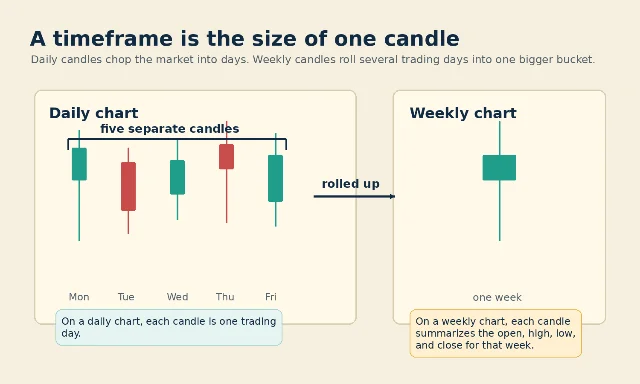
Think of it like changing the zoom on a map. The city did not move. You simply changed whether you are looking at streets or neighborhoods.
What changes when you switch from daily to weekly
A daily chart gives you more candles. That can be useful when you want to see short-term wiggles, gaps, and fast changes. The tradeoff is that the chart can feel noisy because every trading day gets its own candle.
A weekly chart gives you fewer candles. Each one rolls several trading days into one bigger summary. That can make broad direction easier to see, but it hides some of the day-by-day movement inside each weekly candle.
Neither view is more honest than the other. They answer different questions:
- Use a daily chart when your question is, "What happened day by day?"
- Use a weekly chart when your question is, "What has been happening over several weeks?"
A real chart example: MSFT on two clocks
Here is Microsoft shown two ways, using Yahoo Finance chart data for MSFT daily and weekly candles through July 2, 2026. 2 3
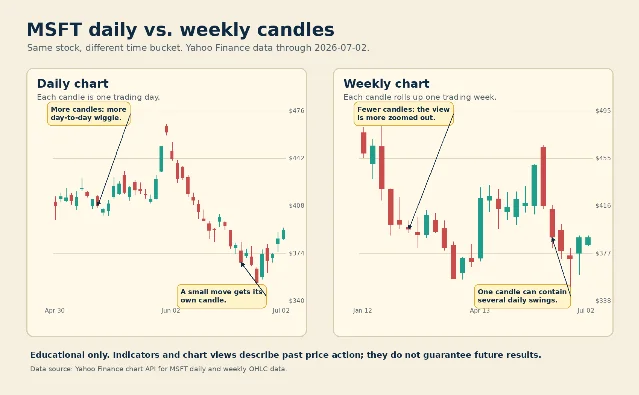
Look at the left side first. The daily chart has many candles packed together. Small moves get their own visible bodies and wicks. A beginner may look at one red candle and feel as if something dramatic happened, even when it is only one day inside a longer sequence.
Now look at the weekly chart. The same stock appears with fewer candles because each candle covers a full trading week. Some of the small daily back-and-forth has been compressed. You are no longer reading every step. You are reading bigger footprints.
This is why two people can look at the same stock and sound as if they disagree, even when both are reading correctly. One may be talking about the daily chart. The other may be talking about the weekly chart.
Beginner mistake: mixing clocks mid-thought
The common mistake is switching timeframes without changing the question.
For example, a beginner might notice a broad move on the weekly chart, then jump into the daily chart and treat one or two candles as proof that the broader view has failed. That is like judging a road trip by one red light.
A better habit: say the question out loud before changing charts.
- "I am using the weekly chart to understand the bigger backdrop."
- "I am using the daily chart to inspect the recent details."
That one sentence keeps the chart from bossing you around. You decide what you are trying to read, then choose the timeframe that fits.
Where this sits in the ladder
This is Lesson 2 in the Chart School ladder. Lesson 1 covered what a single candlestick shows. This lesson adds the missing clock: the candle only makes sense after you know whether it represents a day, a week, or another period.
Next week, we move to volume. Volume means how many shares traded during the period. It helps answer a different beginner question: "Did many people participate in that move, or was it thin?"
One reminder to carry forward: indicators and chart views describe the past. They do not guarantee the future. This series is educational only, not investment advice.
Más de este canal
Contenido relacionado
- Inicia sesión para comentar.