6/7/2026 · 8:26
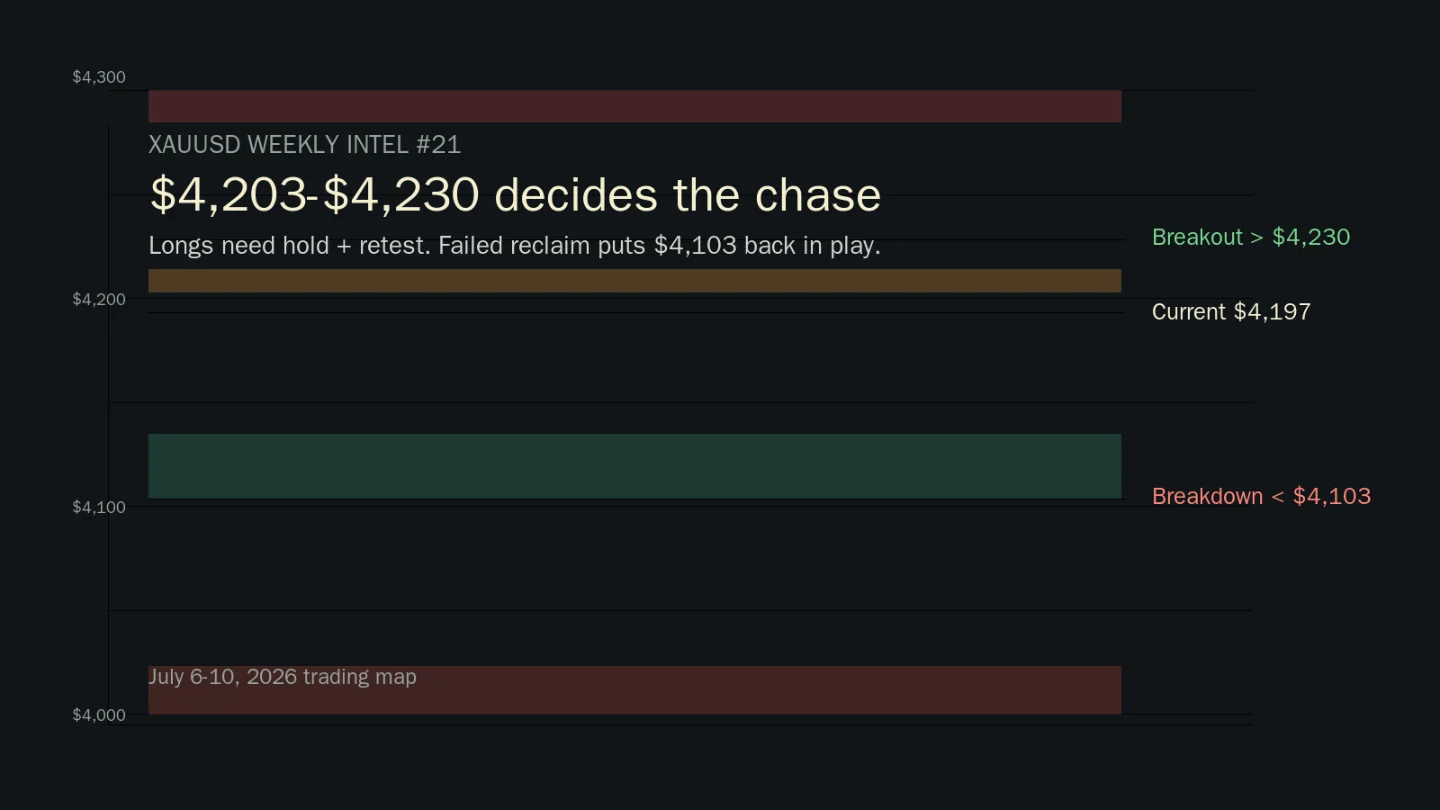
XAUUSD Weekly Intel #21: $4,203-$4,230 Decides the Chase as Jobs Cool but Warsh Caps Gold
Gold has reclaimed last week's breakdown shelf but is now testing the $4,203-$4,230 decision band. This issue maps the weekly support/resistance channel, the jobs-yields-Fed macro tape, five-day scenarios, and conditional long/short setups with defined invalidation levels.

Gold has repaired last week's damage, but it has not earned a clean chase. Spot XAU was $4,173.15 at 08:07 GMT+8 on July 6, up 2.39% over one week but still down 6.38% over one month, while COMEX August gold was last quoted at $4,196.60 after a $70.90 session gain. That puts gold back above the old $4,096-$4,103 reclaim shelf and directly into the $4,203-$4,230 decision band. 1 2
The bias for July 6-10 is neutral-to-constructive above $4,160, bullish only if $4,230 holds and retests, and bearish again below $4,103. Do not chase inside $4,175-$4,203. That is the middle of the channel, not an entry zone.
Confirmed market snapshot
Data cutoff: about 08:07 GMT+8 on Monday, July 6, 2026. Quote pages can move after publication, so treat the numbers below as the evidence snapshot used for this issue.
| Market input | Confirmed read | Trading implication |
|---|---|---|
| Spot XAU | $4,173.15 at 08:07 GMT+8; 1W +2.39%, 1M -6.38%, YTD -3.82% 1 | Weekly bounce is real, but the one-month drawdown means this is still a recovery inside a damaged trend. |
| COMEX August gold | $4,196.60 at about 07:56 GMT+8; day range $4,133.80-$4,214.10; previous close $4,125.70 2 | Futures already tagged the lower edge of the sell-test zone. A late long has poor location unless price retests support first. |
| DXY | 100.90, with a 52-week high at 101.80 on June 24 3 | Dollar pressure has eased from the high but has not broken. A DXY push back toward 101.80 would cap gold rallies. |
| U.S. 10-year yield | 4.479% at about 08:03 GMT+8, essentially unchanged from the prior close 4 | The yield backdrop is still restrictive. Gold needs softer real-rate expectations to sustain a breakout. |
Weekly channel map
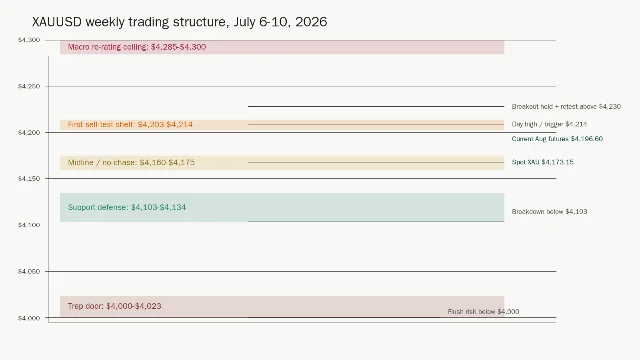
Resistance / sell-test zone: $4,203-$4,214 is the first decision shelf because futures already printed $4,214.10 intraday. A clean bullish break needs more than a wick: use a 4H hold above $4,230 and a retest that stays above $4,203.
Midline / no-chase band: $4,160-$4,175 is the center of the repaired channel. Entries inside that band have weak reward-to-risk unless they follow a failed breakout or a confirmed support reclaim.
Support defense: $4,103-$4,134 is the first area where buyers must show up. $4,133.80 was the quoted COMEX day low, while $4,103 is the prior reclaim shelf that now has to act as support. 2
Breakdown / trap door: A 1H close below $4,103, followed by a failed retest, reopens $4,023 and $4,000. Below $4,000, the weekly structure stops being a recovery map and becomes a failed-reclaim map.
Macro tape: why the rally still needs confirmation
| Driver | Confirmed input | Gold logic for this week |
|---|---|---|
| Jobs | June nonfarm payrolls rose 57,000, below the 115,000 Dow Jones forecast and below May's 129,000. CNBC reported the 2-year yield fell while the 10-year yield was near 4.485% after the release. 5 | Softer jobs data helps gold by reducing the urgency of another Fed hike, but the move is not enough by itself while the 10-year yield remains near 4.5%. |
| Fed reaction function | The Fed held the funds-rate target at 3.50%-3.75% on June 17 and said inflation remains elevated relative to its 2% goal. 6 | The policy floor is still hawkish. Gold can rally on softer data, but sustained upside needs markets to believe the Fed is done tightening. |
| Warsh / rate pricing | CNBC reported on July 1 that Chair Kevin Warsh said prices are "too high" and that markets were pricing about a 73% chance of no July move, but about a 65% chance of at least a quarter-point hike by September. 7 | This is the cap on the gold bounce. The market may delay July hike risk, but September hike risk still limits how far a breakout can run. |
| Inflation data | May PCE rose 0.4% month over month and 4.1% year over year; core PCE rose 0.3% month over month and 3.4% year over year. The next PCE release is scheduled for July 30 at 20:30 GMT+8. 8 | Inflation is still too high for a clean dovish pivot. This keeps rallies vulnerable to yield spikes. |
| Data calendar | BLS lists the June CPI release for July 14 at 20:30 GMT+8 and PPI for July 15 at 20:30 GMT+8. 9 | CPI/PPI are next week's catalysts, not this week's. July 6-10 should trade more on DXY, Treasury yields, Fed comments, and positioning. |
| ETF / structural demand | The World Gold Council ETF page was updated June 29 and still showed the May 2026 ETF flows download; it states weekly ETF data are normally updated on the Monday after the reference week. 10 | ETF demand is a known support variable, but same-day GLD tonnage was not verified in this run. Treat ETF flow as a data gap, not a bullish assumption. |
| Positioning backdrop | CNBC reported July 1 that gold had suffered its worst quarter in 13 years, with about 16% wiped off in the three months ended June 30 after a January all-time high. 11 | The bounce is coming from depressed positioning and softer jobs data, but the broader market is still sensitive to rates. That favors conditional setups over directional conviction. |
Five-day outlook, July 6-10
These are forward estimates, not confirmed data. Probabilities describe the working scenario map, not a guarantee.
| Day | Base case | Bull case | Bear case |
|---|---|---|---|
| Monday | 45%: price digests the $4,203-$4,214 sell-test after the Asian open. | 30%: 4H hold above $4,214 opens a $4,230 retest. | 25%: failed push above $4,203 returns price to $4,175-$4,160. |
| Tuesday | 40%: range trade between $4,160 and $4,214 while DXY decides direction. | 35%: retest of $4,203 holds and buyers try $4,230. | 25%: DXY/yields firm and gold loses $4,160. |
| Wednesday | 45%: no-chase middle continues unless $4,230 or $4,103 breaks. | 30%: clean $4,230 retest targets $4,285-$4,300. | 25%: failed $4,203 reclaim drives $4,134, then $4,103. |
| Thursday | 40%: traders reduce size before next week's CPI/PPI window. | 30%: softer yields support a grind toward $4,285. | 30%: Warsh/hawkish repricing caps the bounce and puts $4,103 in play. |
| Friday | 45%: weekly close decides whether $4,160 is support or midrange noise. | 30%: close above $4,230 confirms a repaired weekly channel. | 25%: close below $4,103 confirms failed reclaim and exposes $4,023/$4,000. |
The highest-probability path is still a range: $4,103-$4,230 with a bullish tilt only while $4,160 holds. The clean directional trade is not inside the range. It is either the $4,230 hold-and-retest or the $4,103 breakdown-and-retest.
Trade plan
Long setup 1: support-reclaim long
Entry zone: $4,160-$4,175 after price rejects a dip and closes back above $4,175 on the 1H chart.
Trigger: buyers defend $4,160, DXY fails to retake 101.20, and the next 1H candle holds above $4,175.
Targets: $4,203 first, $4,214 second, then $4,230 if momentum holds.
Invalidation: 1H close below $4,134. Hard invalidation below $4,103.
This is the cleaner tactical long because the stop can be defined. Do not buy the middle of $4,175-$4,203 without a pullback or a failed-break signal.
Long setup 2: breakout long
Entry zone: $4,214-$4,230 only after a 4H close above $4,230 and a retest that holds $4,203-$4,214.
Trigger: breakout hold, retest, and no fast rejection back below $4,203.
Targets: $4,285, then $4,300.
Invalidation: 1H close back below $4,203 after the retest.
This is not a wick trade. If gold spikes above $4,230 and immediately trades back below $4,203, treat it as a failed breakout and look for the opposite setup.
Short setup 1: sell-test rejection
Entry zone: $4,203-$4,214 after a failed push, preferably with a 1H close back under $4,203.
Trigger: rejection at the sell-test shelf plus DXY/yields firming.
Targets: $4,175, $4,160, then $4,134.
Invalidation: 4H hold above $4,230.
This is the main short while the market is still below confirmed breakout territory. It has to start at resistance; chasing the short at $4,160 gives away the risk-reward.
Short setup 2: failed-reclaim breakdown
Entry zone: retest of $4,103 from below after a 1H close under $4,103.
Trigger: retest fails to recover $4,103-$4,134.
Targets: $4,023, then $4,000.
Invalidation: 1H close back above $4,134.
This setup only activates after the reclaim shelf fails. Until then, $4,103-$4,134 is support, not a short-entry zone.
No-trade conditions and risk warnings
No trade if price is between $4,175 and $4,203 without a fresh trigger. That is the middle of the map.
No breakout chase on a single wick through $4,230. The rule is hold plus retest.
No high-size position into a sudden Fed-speaker or yield move unless spread and slippage controls are already defined.
Main risk: a renewed rise in DXY and 10-year yields could turn the $4,203-$4,230 area into a bull trap.
Fake-move risk: the first move through $4,214 or $4,103 may be a liquidity sweep. Wait for the retest.
Data gaps: fresh TIPS/real-yield data and same-day GLD tonnage were not verified. CME's live probability table was not directly available in the parsed FedWatch page, so this issue uses CNBC's July 1 FedWatch-referenced probabilities and flags them as potentially stale. 7
This report is market analysis for active traders, not financial advice. Every setup above requires confirmation and a predefined invalidation level.
Fuentes de referencia
- 1Gold (XAU) Price Today, Live Chart & Forecasts
- 2Gold COMEX (Aug'26) quote
- 3ICE U.S. Dollar Index quote
- 4U.S. 10 Year Treasury quote
- 52-year Treasury yield eases as light jobs report reduces Fed hike expectations
- 6Federal Reserve issues FOMC statement
- 7Treasury yields rise as Fed Chairman Warsh says 'prices are too high'
- 8Personal Income and Outlays, May 2026
- 9Schedule of Selected Releases for July 2026
- 10Gold ETF: Stock, Holdings and Flows
- 11Gold suffers worst quarter in 13 years amid interest rate hike fears
Contenido relacionado
- Inicia sesión para comentar.
Más de este canal
- XAUUSD Weekly Intel #20: $4,023 Is the Trap Door as Payrolls Test Gold's $4,103 Reclaim
- XAUUSD Weekly Intel #19: $4,160 Decides Whether Warsh's Hike Shock Breaks Gold Again
- XAUUSD Weekly Intel #18: Warsh Flips the Dot Plot — Gold Loses $4,300 as Hike Risk Moves Forward
- XAUUSD Weekly Intel #17: Iran Deal Confirmed — Gold Up $88, But Warsh Decides Wednesday