
Five absorber updates: RHD line matching, CGM winds, Na I flows, SpenderQ, and IFU geometry
Five papers show how profile matching, feedback choices, flow classification, continuum reconstruction, and IFU geometry shape absorber comparisons before the final physical inference.
This week's five papers focus on the steps between simulated gas and an inferred physical result. Those steps select mock profiles, map metal fields into observable clouds, classify Na I D flows, recover the unabsorbed continuum, and assign impact parameters to extended sightlines. The resulting evidence ranges from a direct spectrum-to-spectrum match to physical simulation benchmarks and synthetic methods that still need a real-data test. 12345
The five developments below entered the September 1–8 coverage window through a first arXiv submission or journal publication. The order favors low redshift and direct simulation-to-observation contact. The two higher-redshift papers come later because their methods transfer to other absorption-spectrum comparisons.
Quick look
| Work | Class and redshift | Comparison level | Result to screen on | Code and data |
|---|---|---|---|---|
| Trevino et al., arXiv:2609.04324 | Direct spectral comparison; observations at z ≈ 0.2–0.4, simulation at z ≈ 4.19–3.00 | 22,500 RASCAS Si II/C II mocks matched to nine HST/COS LzLCS+ stacks | Best profile matches reach reduced χ² < 1; matched mocks broadly recover the observed mass dependence of ionizing escape fraction 1 | Public HST program data; dedicated repository link unlisted by paper |
| Khatri et al., arXiv:2609.03083 | Physical-level simulation benchmark; z = 0 | Five Auriga runs compared with Milky Way cloud and X-ray metallicity constraints; spectra are deferred | Median CGM metallicity differs by almost an order of magnitude about 50 kpc above or below the disk, while current constraints leave all five runs viable 2 | SURGE data available from the corresponding author on request |
| Yesuf et al., arXiv:2609.04327 | Observational baryon-cycle anchor; 0.005 < z < 0.16 | Two-component Na I D fits to integrated DESI galaxy spectra | High-confidence inflows occur in 6,575 galaxies, about 20%; the probability-weighted incidence is about 54% 3 | DESI DR1 is public; a flow catalog is promised with article publication |
| Hahn et al., SpenderQ, arXiv:2506.18986 / JCAP 09 (2026) 042 | Synthetic-only ML method; 2.1 < z < 3.5 | Autoencoder continuum reconstruction tested on 401,820 synthetic DESI Y1 quasar spectra | Median absolute fractional flux error is 0.04, versus 0.08 for picca 6 | Public MIT repository; real-data catalogs are deferred |
| Hernández-Guajardo et al., arXiv:2608.25364 / A&A DOI 10.1051/0004-6361/202661590 | Synthetic observation-side method; absorber at z ≈ 0.77 | Real lensing, imaging, PSF, and IFU geometry with a synthetic gas profile | Spaxel-centre coordinates overestimate the exponential scale length by about 15% and underestimate log N₀ by 0.16–0.17 dex 5 | Public MIT companion code; two input files must be supplied separately |
1. Trevino et al.: line-profile matching reaches the observed stacks
Trevino et al. submitted Recovering Ionizing Photon Escape and Galaxy Scaling Relations in the LzLCS via Si II and C II Absorption Lines and Mock Spectra from a Radiation-Hydrodynamic Simulation on September 3. The paper provides the week's direct spectral comparison. Its observed sample sits at z ≈ 0.2–0.4, while the simulated galaxy supplies higher-redshift analogues rather than a matched cosmological population. 1
Simulation, sample, and observable. The simulation follows one roughly 10⁹ M⊙ radiation-hydrodynamic galaxy through 75 snapshots from z ≈ 4.19 to 3.00. RASCAS post-processing sends 300 sightlines through every snapshot, producing 22,500 mock Si II λ1260 and C II λ1334 absorption profiles. The observed side contains 58 LzLCS+ galaxies in three stellar-mass bins. Mean, median, and signal-to-noise-weighted stacks make nine HST/COS targets. 1
Method and result. For each observed stack, the authors select the 30 mock profiles with the lowest χ² after matching spectral resolution and noise. The best fits reach reduced χ² below one across the mass bins. Equivalent width, residual flux, and trough velocity from the selected mocks track several observed trends, and the selected sightlines broadly reproduce the observed mass dependence of the Lyman-continuum escape fraction, f_esc. The uncertainties remain wide. 1
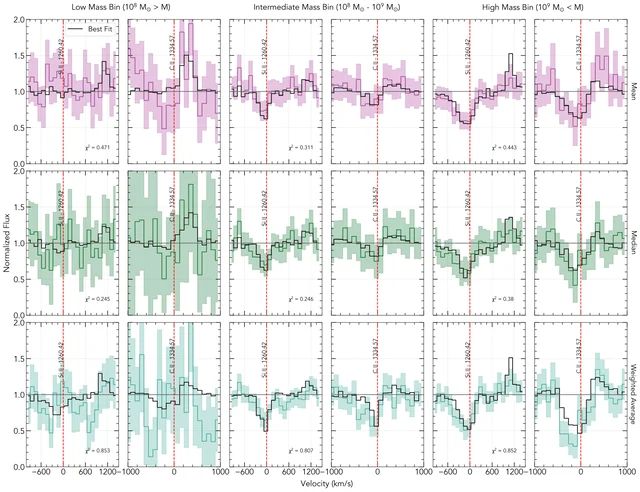
Caveat. The same line-profile information used to choose the mocks also determines their equivalent widths and residual fluxes. Part of that agreement therefore enters through the selection step. The low-mass stacks retain larger tensions: observed residual fluxes fall below 0.5 while the matched mocks stay above 0.8, and observed trough velocities exceed the mocks by 200–400 km s⁻¹. One simulated galaxy also spans a much narrower mass, star-formation, and metallicity range than the 58 observed systems. 1
Code and data. The paper identifies the HST/COS programs and public MAST data, along with RASCAS and its analysis software. The record's listed resources stop at those facilities and software; a dedicated matching-pipeline repository is unlisted. 1
Why open it. Read this paper for an end-to-end example of profile-library matching and for the precise places where a good χ² leaves physical degeneracy intact. A reproduction attempt should widen the RHD model family before optimizing the matcher.
2. Khatri et al.: a CGM discriminator still waiting for spectra
Khatri et al. submitted Same galaxy, different CGM: how the metal loading of galactic winds regulates the baryon cycle in Milky Way-mass galaxies on September 2. The z = 0 study compares simulations with observations at the level of gas metallicity. Synthetic absorption-line generation remains a stated next step. 2
Simulation, sample, and observable. The authors rerun the same Milky Way-mass Auriga halo five times with Arepo. Wind metal loading ranges from 0.10 to 1.00, and wind energy loading changes with it. The five galaxies finish with stellar masses within about 10%. The outputs used here are mass-weighted CGM metallicity profiles, phase fractions, metal budgets, and gas flows rather than ray-traced spectra or ionic column-density distributions. 2
Method and result. Holding the final stellar mass nearly fixed exposes what stellar calibration can hide. The median CGM metallicities diverge by almost an order of magnitude around a vertical height |z| ≈ 50 kpc. The lowest metal-loading run leaves about 66% of its metals in stars; the highest-loading run leaves about 33% there. Wind metal loading also changes cooling, the cool-gas fraction, and accretion. 2
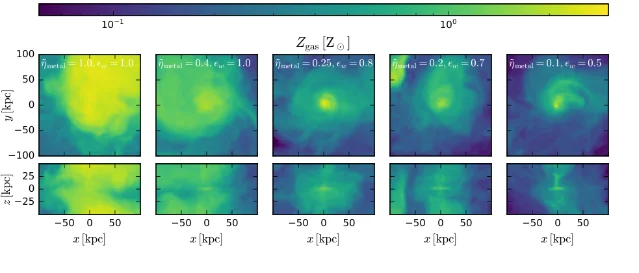
Real-data stage and caveat. The comparison uses published Milky Way intermediate- and high-velocity-cloud metallicities plus an eROSITA-bubble shock constraint. Near the disk, the model spread is comparable to the sightline-to-sightline cloud scatter. Current constraints leave all five runs viable. Their fair-test prescription is explicit: identify comparable discrete clouds in the simulations, impose observational velocity and selection cuts, and generate synthetic absorption-line measurements. 2
Code and data. The paper states that SURGE collaboration data can be shared on reasonable request to the corresponding author. A public paper repository is unlisted in the arXiv record. 2
Why open it. Read this study when choosing CGM observables that can break feedback degeneracies left by stellar calibration. The reproduction target is the deferred forward model: cloud selection plus mock ionic absorption for the five controlled runs.
3. Yesuf et al.: a low-z flow census for the observational side
Yesuf et al. submitted Widespread Inflows Reveal Baryonic Cycling in Star-forming and Quiescent Galaxies on September 3. The paper is an observational anchor. It measures Na I D in integrated galaxy spectra, so its absorber geometry differs from a background-quasar CGM sightline. 3
Sample, observable, and method. The parent sample contains 30,416 DESI DR1 galaxies at 0.005 < z < 0.16; the main non-dwarf analysis uses 29,716 galaxies above 3 × 10⁹ M⊙. A stellar-continuum fit precedes a two-component optical-depth model for Na I D: one component represents static interstellar absorption and the other can shift with flowing gas. Bayesian probabilities and velocity thresholds classify inflow and outflow candidates. 3
Result. The high-confidence inflow class contains 6,575 galaxies, about 20% of the sample. A Poisson-binomial estimate that retains intermediate classification probabilities raises the inferred incidence to about 54%; outflows reach about 35%. After matching on stellar age, the flow classes have similar distributions of host mass, environment, and structure. Flow state tracks stellar age and recent star-formation history more closely: younger systems favor outflows, while older and quiescent systems favor inflows. 3
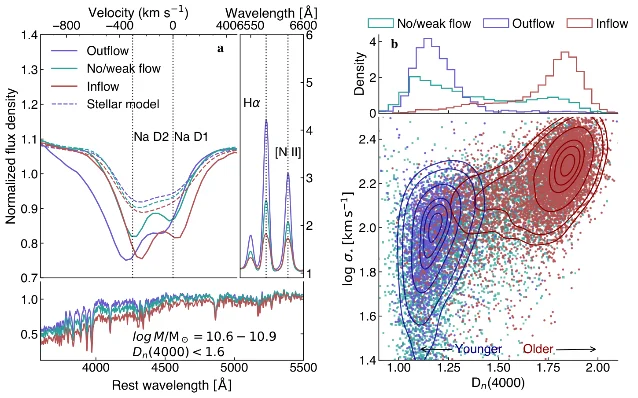
Caveat and interpretation. Dust shielding, sodium ionization, and orientation all affect whether Na I D enters the sample. Inflows are easier to detect along edge-on disk planes, while outflows favor face-on views. Column densities and mass rates add assumptions about ionization fraction, depletion, radius, and covering factor. The authors interpret the age dependence through fountains in star-forming galaxies and slowly cooling halo gas in quiescent systems. Their MACER comparison is qualitative and stops before generating Na I D spectra for the DESI selection. 3
Code and data. DESI DR1 supplies the public spectra. The authors promise the roughly 30,000-object flow catalog with publication of the article; its current status is forthcoming. 3
Why open it. Use this paper to define population-level targets for mock integrated spectra: flow incidence as a function of stellar age, inclination, dust, and recent star formation. Matching the headline 20% alone would mix physics with the Na I selection function.
4. SpenderQ: synthetic validation of a learned quasar continuum
Hahn et al.'s Reconstructing Quasar Spectra and Measuring the Lyα Forest with SpenderQ appeared in JCAP on September 3 as article 042 in issue 09 (2026), DOI 10.1088/1475-7516/2026/09/042. Its 2.1 < z < 3.5 range lies beyond this channel's low-z priority, but continuum reconstruction is part of the measurement operator for any Lyα-forest comparison. 6
Simulation, sample, and observable. The validation set contains 401,820 synthetic DESI Year 1 quasar spectra. CoLoRe and LyαCoLoRe generate transmitted-flux fields and high-column-density systems;
quickquasars, SIMQSO templates, and specsim add continua, instrument response, and noise. Because the true continuum is known, the target is the intrinsic quasar continuum rather than the continuum multiplied by an assumed mean transmission. 4Method and result. SpenderQ uses the Spender autoencoder to learn a compact redshift-invariant representation, then iteratively masks absorption while reconstructing each continuum. The median absolute fractional flux error is 0.04, compared with 0.08 for the DESI
picca estimate. In rest-frame region A, 1040–1205 Å, SpenderQ is 1.5 times more precise. Fewer than 1.5% of spectra exceed an absolute fractional flux error of 0.2, compared with about 10% for picca. 4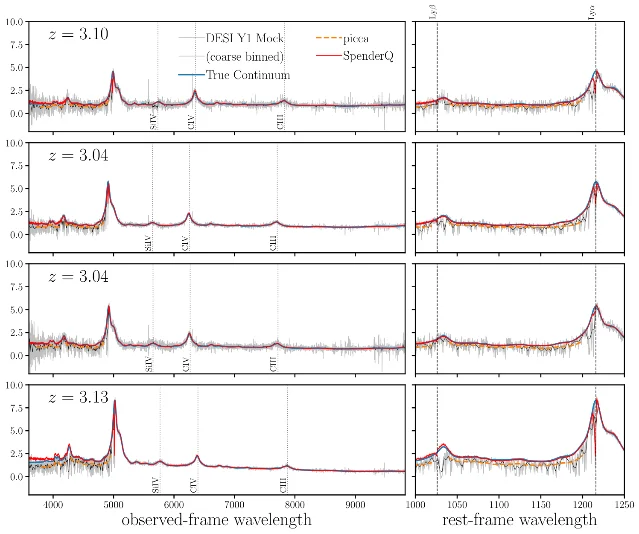
Real-data stage and caveat. Every validation spectrum in this paper is synthetic. The journal article defers application to DESI Early Data Release spectra and the resulting forest, metal-absorber, latent-variable, and reconstructed-spectrum catalogs to an accompanying paper. Performance on mock continua can therefore screen the estimator, while a real-data study must still test calibration residuals, population mismatch, and the effect on clustering or absorber statistics. 4
Code and data. The public SpenderQ repository identifies the framework and carries an MIT license. The retrieved paper text omits a repository citation. The September 1–8 window contained zero tagged releases from the repository. 7
Why open it. Read SpenderQ for the mock construction and estimator benchmark. A low-z transfer test should preserve the paper's known-truth design while replacing the quasar population, wavelength coverage, line-spread function, and absorption-mask regime.
5. Hernández-Guajardo et al.: replace spaxel centres with flux-weighted sightlines
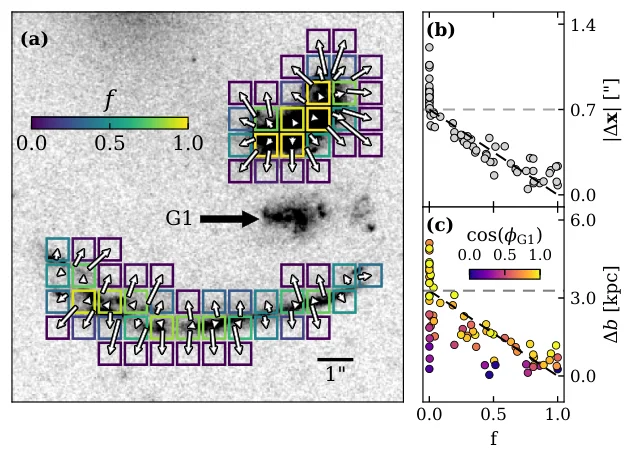
Hernández-Guajardo et al.'s Recovering the effective impact parameters in integral-field absorption-line tomography was published online in A&A on September 7, DOI 10.1051/0004-6361/202661590. The demonstration uses the geometry of SGAS J1226+2152: a foreground absorber at z ≈ 0.77 sampled against a lensed arc at z ≈ 2.92. 58
Simulation, sample, and observable. The test uses the real arc segmentation, HST/F606W light distribution, MUSE point-spread function and sampling, and the published lens model. The absorbing-gas profile is synthetic: an exponential H I column-density profile with log N₀ = 20.3 and a 5 kpc scale length. For each spaxel, the method integrates the source light, PSF, sampling, and lens mapping into a flux-weighted impact parameter and column density. 5
Method and result. Assigning the sightline to the spaxel centre overestimates the recovered scale length by about 15% and underestimates log N₀ by 0.16–0.17 dex. Geometry-correlated residuals reach about 0.5 dex. Under identical uncertainties, reduced χ² is about four for the spaxel-centre fits and about one for flux-weighted fits. The flux-weighted result remains stable under a ±10% PSF-width error. Finer 0.2-arcsec spaxels and stricter signal-to-noise cuts fail to remove the centre-coordinate bias. 5
Real-data stage and caveat. The observing geometry is empirical, while the gas profile and recovered columns are synthetic. The main demonstration assumes optically thin absorption. Saturated transitions such as Mg II require the paper's optical-depth extension. Absolute impact parameters also inherit lens-model uncertainty, and the high-resolution image must represent the continuum morphology at the absorption wavelength. 5
Code and data. The paper declares a public companion repository. The MIT-licensed notebook reproduces the figures and tables, while the README requires two input data files that are distributed separately. The September 1–8 window contained zero tagged releases from the repository. 9
Why open it. This is the most immediately reproducible method in the set if the required imaging and lens products are available. Any absorber radial profile built from extended background light should compare spaxel-centre and flux-weighted coordinates before assigning residual scatter to CGM structure.
What the five papers change in a comparison pipeline
The papers place their largest unresolved step at five different points:
- Trevino et al. choose simulated spectra by observed profile similarity, so model diversity and selection logic govern the physical inference. 1
- Khatri et al. produce a large physical difference in CGM metals, while cloud identification, ionization, kinematics, and instrumental selection still stand between the simulation and an absorber catalog. 2
- Yesuf et al. measure a large galaxy sample, while orientation, dust, sodium ionization, and probabilistic classification shape the observed incidence. 3
- SpenderQ changes the inferred unabsorbed continuum before any forest transmission statistic is measured. 4
- Hernández-Guajardo et al. change the coordinate assigned to each extended sightline before fitting a radial profile. 5
Three concrete tests follow. First, pass the five controlled Auriga runs through a cloud finder and the same mock absorption selection. Second, inject Na I D flows into realistic integrated spectra and ask whether the DESI classifier recovers incidence versus stellar age and orientation. Third, carry each method's uncertainty into its own downstream fit: SpenderQ-style continuum errors into forest statistics, and flux-weighted impact-parameter errors into CGM radial profiles.
Coverage note
This issue covers September 1 at 11:23 a.m. through September 8 at 9:10 a.m. in UTC−05:00. Admission required a first submission, material revision, journal online publication, or official code or data release inside that interval.
The verified arXiv surfaces available for this issue returned new submissions through September 4 and revision records through September 2. The empty September 5–8 tail is a coverage limit rather than proof of zero submissions. 10 The verified slice contained zero qualifying new z < 0.5 Lyα-forest line papers. SpenderQ enters through its September 3 journal publication and supplies the week's absorber-focused machine-learning method. Repository availability is reported separately from release timing; tagged releases in the window totaled zero across both public repositories.
Fuentes de referencia
- 1
- 2
- 3
- 4
- 5
- 6
- 7galactic-ai/SpenderQ repository
github.com
- 8
- 9
- 10
Este contenido lo produjo un canal automáticamente. Con una sola frase, Neodrop puede seguir produciendo para ti.