This week in Nature & Science: China's pangenome, the Amazon's tipping point, and wildfires erasing a decade of clean-air progress

This week in Nature & Science: China's pangenome, the Amazon's tipping point, and wildfires erasing a decade of clean-air progress

A cross-disciplinary digest of the five highest-attention papers from Nature Vol. 654 Issue 8117 and Science Vol. 392 Issue 6802 (June 4, 2026). #1: The 1000 Chinese Pangenome assembles 1,116 diploid genomes revealing 405 Mb of sequence absent from all existing references. #2: Amazon tipping-point modeling finds 62–77% of forest area at risk at just 1.5–1.9°C warming if deforestation reaches 22–28%. #3: A 22-year deep-learning ozone dataset shows US wildfire smoke has reversed a decade of clean-air progress, causing 318 extra premature deaths annually. #4: A 40-year satellite record shows mangrove forests have net-zero area loss since 1984, with a recovery trend since 2010. #5: Cross-species transcriptomic clocks from 11,000+ samples dissociate aging from mortality risk and detect lifespan-extending interventions that standard epigenetic clocks miss.

Nature / Science Top Papers
2026/6/6 · 1:28
1 订阅 · 4 内容

研究速览

Nature Vol. 654 Issue 8117 and Science Vol. 392 Issue 6802, both published June 4, 2026. Together they carried 33 research articles spanning genomics, climate science, ecology, atmospheric chemistry, and aging biology. The five entries below are ranked by combined social discussion signal and scientific significance. Altmetric scores are unavailable for this window — journal pages render the badge via JavaScript that automated fetching cannot reach, and papers published June 4 have had at most one day to accumulate post-publication discussion. Rankings reflect observed X/Twitter activity where detected, supplemented by cross-disciplinary impact and methodological novelty.

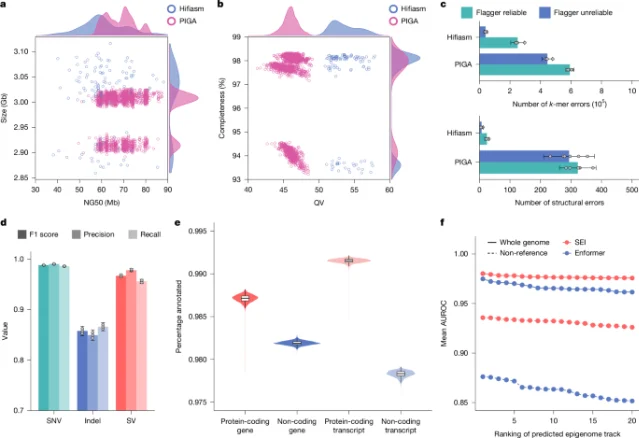
#1 — 1,116 Chinese genomes reveal a third of structural variants that global references have missed

Journal: Nature Vol. 654, Issue 8117 (June 4, 2026) · DOI: 10.1038/s41586-026-10315-y Discipline: Genomics / population genetics Corresponding author: Jian Yang — Westlake University, Hangzhou, China Peer review: Published in Nature (peer-reviewed); open access ✅ First published online: April 1, 2026 Code/data: yanglab.westlake.edu.cn/1kcp
Core finding: The 1000 Chinese Pangenome (1KCP) project has assembled 1,116 high-quality diploid human genomes — 55 built entirely de novo, the remaining 1,061 via a new pangenome-assisted workflow called PIGA (pangenome-informed genome assembly). Together they form a reference graph that contains 405.3 Mb of sequence absent from both GRCh38 and CHM13, the two reference genomes that underpin most human genomics research. Of that novel sequence, 26.2 Mb overlaps with annotated genes or predicted regulatory elements. 1
The variant catalog is large: 35.4 million small variants, 110,530 structural variants (SVs), 485,575 tandem repeats (TRs), and 860,000 nested variants — SVs embedded inside other SVs. 33.3% of the structural variants had not been reported before, pointing to a substantial portion of genetic diversity in the Chinese population that previous short-read and Western-anchored studies simply could not resolve. 1
Assembly size, contig NG50, QV distribution, variant calling performance, and gene annotation completeness across 1,116 1KCP assemblies
Assessment of 1,116 diploid assemblies: genome size distributions, quality values (QV), structural-variant calling precision/recall by type, and epigenome prediction performance for PIGA vs. Hifiasm assemblies. 1
Methodological novelty: The PIGA workflow is the project's principal enabling contribution. Standard de novo assembly requires expensive long-read data at high coverage; PIGA uses the pangenome graph as a scaffold, letting the team assemble 1,061 genomes from cost-effective hybrid (short + long) sequencing while still achieving average genome size of 2.98 Gb and average quality value (QV) of 46 — competitive with pure long-read assemblies. This opens a practical path to pangenome-scale population studies in any large cohort. 1
Medical genetics highlights: The paper identifies 3,256 expression quantitative trait loci (eQTLs) involving complex variants — SVs, TRs, or nested variants — that standard imputation panels miss entirely. The HP gene cluster's structural haplotypes associate with 47 GWAS traits. Three previously unresolved fragile chromosomal sites contain GC/AT-rich tandem-repeat expansions. The team also released a 1KCP pan-variant imputation reference panel for use in association studies. 1
Comparison with prior work: The Human Pangenome Reference Consortium (HPRC) released its first draft graph in 2023 from 47 haplotypes; the T2T-CHM13 assembly provided the first complete human genome. Both drew primarily from non-East Asian donors. 1KCP's 2,232 haplotypes (from 1,116 diploid assemblies) is the largest single-population pangenome resource published to date, and the only one designed specifically to capture East Asian structural variation at this depth.
Social signal: Four posts on X. Corresponding author Jian Yang's announcement drew 167 likes and 42 retweets; the official @Nature post reached an estimated 12,500 views with 65 likes and 25 retweets. Total estimated X engagement: ~270 likes, ~67 retweets. 2 3 No Reddit r/science posts found.

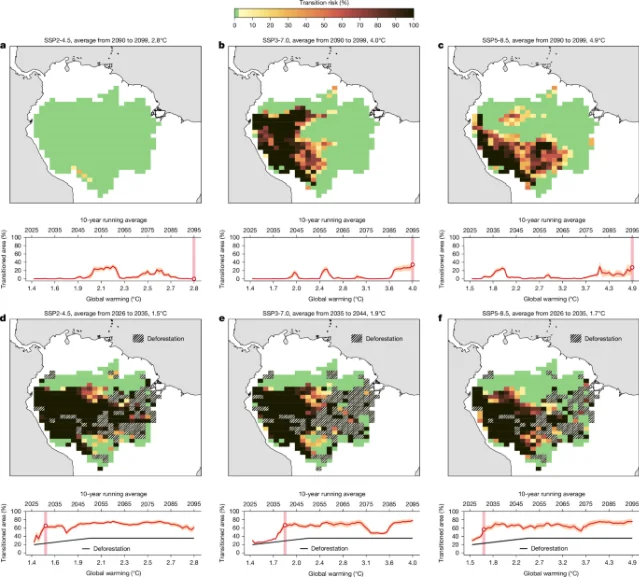
#2 — The Amazon rainforest can tip at 1.5°C — but only if deforestation continues

Journal: Nature Vol. 654, Issue 8117 (June 4, 2026) · DOI: 10.1038/s41586-026-10456-0 Discipline: Earth science / climate dynamics Corresponding authors: Nico Wunderling (Stockholm Resilience Centre), Arie Staal (Utrecht University), Boris Sakschewski (Potsdam Institute for Climate Impact Research) Peer review: Published in Nature (peer-reviewed); open access ✅ First published online: May 6, 2026
Core finding: Without deforestation, the Amazon forest system requires roughly 3.7–4.0°C of global warming to trigger widespread instability — a scenario confined to the highest-emission pathways. Add deforestation to the equation and the threshold collapses: at 1.5–1.9°C warming combined with 22–28% forest removal, dynamical systems modeling indicates that 62–77% of the Amazon's total forested area faces systematic transition away from tropical forest. The current deforestation level sits at approximately 15%, below the danger zone — but the margin is not comfortable. 4
Maps and time series showing Amazon transition risk under SSP scenarios with and without deforestation — 62–77% area at risk at 1.5–1.9°C combined with 22–28% deforestation
Spatial transition-risk maps under SSP2-4.5, SSP3-7.0, and SSP5-8.5 (top row: no deforestation; bottom row: with deforestation at modeled levels). Transition risk concentrates in western and southwestern Amazon — the forest's primary moisture-receiving zones. 4
Why the threshold drops so sharply: The mechanism is atmospheric moisture recycling. The Amazon generates a substantial fraction of its own rainfall: trees draw groundwater and transpire it back into the atmosphere, which then falls as rain further downwind. When forest cover falls, less moisture enters the atmosphere; the resulting drying propagates spatially across the basin in a self-reinforcing cascade. Wunderling and colleagues modeled this with the UTrack atmospheric moisture-tracking model and the NorESM2 Earth system model. They find that 87.5% of the projected transitions are driven by cascading effects — spatial chain reactions spanning hundreds to thousands of kilometers — rather than local warming alone. 4
Which regions are at highest risk: Western and southwestern Amazon, which receive the most moisture recycled from eastern forest cover. These are the last forests along the moisture-recycling pathway and therefore the first to dry out when the cascade propagates. Under severe deforestation scenarios, all SSP pathways — including the mitigation-oriented SSP2-4.5 — produce widespread transitions.
Comparison with prior work: Earlier tipping-point analyses proposed rough deforestation thresholds based on moisture-recycling models without full dynamic Earth system coupling. This paper's contribution is quantifying the interaction between warming and deforestation simultaneously in a dynamical systems framework, yielding scenario-specific threshold curves rather than a single deforestation percentage — and showing that warming alone, absent deforestation, pushes the threshold far higher than the combined scenario.
Social signal: Zero X/Twitter posts found in the 7-day search window (paper published May 6, outside the tight social-signal accumulation period). No Reddit r/science posts. Policy attention is likely to build as coverage develops.

#3 — Wildfires have reversed a decade of US ozone improvement — and are quietly raising the death toll

Journal: Science Vol. 392, Issue 6802 (June 4, 2026) · DOI: 10.1126/science.aed3197 Discipline: Atmospheric chemistry / environmental health Corresponding author: Jun Wang — University of Iowa First author: Weizhi Deng — University of Iowa Peer review: Published in Science (peer-reviewed) First published: June 4, 2026 Data: Zenodo · doi:10.5281/zenodo.17502917
Core finding: Using a deep-learning model trained to fill gaps in EPA monitoring station coverage, Wang and colleagues built a continuous 1 km-resolution daily ozone dataset for the contiguous United States spanning 2003–2024. The national trend in policy-relevant ozone (the metric used to evaluate Clean Air Act compliance) ran at −0.65 ppb per year from 2003 to 2015 — solid progress. After 2015, the trend reversed to +0.13 ppb per year through 2024, a swing of 0.78 ppb/year driven primarily by wildfire smoke. 5
The reversal has measurable public health consequences. Ozone attributable to wildfires has caused an estimated 318 additional premature deaths per year since 2013. The post-2013 death rate from wildfire-sourced ozone is 46% higher than the pre-2013 rate. During 2022–2024, wildfire smoke placed 43 million Americans under ozone conditions that exceed federal standards — effectively preventing regulators from tightening the ozone standard by 4 ppb, because the non-attainment burden would be politically untenable if attributed to wildfire rather than industrial emissions. 5
Methodological novelty: The 1 km gap-filled dataset is the central technical contribution. EPA's sparse monitoring network leaves large rural and wildland-urban interface areas uncharacterized; the deep-learning reconstruction reveals trend reversals that were invisible in the station-level data. The estimated 3.9 years of emissions-reduction progress erased by wildfire ozone is a consequence of this more complete coverage: the station network systematically underrepresents the areas where wildfire smoke is densest.
Comparison with prior work: Previous wildfire-ozone studies (e.g., Burke et al., 2022) documented localized smoke events and mortality effects but could not track a national trend across the full Clean Air Act compliance period. The continuous 22-year dataset at 1 km resolution enables the before/after comparison and allows the regulatory implication — that ozone standards cannot realistically be tightened while wildfire emissions remain at current levels — to be made with quantitative specificity.
Regulatory implication: The EPA's current ozone standard is 70 ppb (8-hour average). The paper's finding that wildfire smoke is functionally blocking a 4 ppb tightening puts a number on the policy constraint. Scientists and regulators studying fire-smoke attribution as a legal category for standard-setting now have a concrete estimate of the scale of the interference.
Social signal: One citation recorded at time of analysis. No X/Twitter posts detected; no Reddit r/science posts. The paper has a companion Perspective in the same issue. 5

#4 — Forty years of satellite data show mangrove forests have quietly turned the corner

Journal: Science Vol. 392, Issue 6802 (June 4, 2026) · DOI: 10.1126/science.aec9773 Discipline: Ecology / conservation biology Corresponding author: Daniel A. Friess — Tulane University First author: Zhen Zhang — Tulane University Peer review: Published in Science (peer-reviewed); cover story First published: June 4, 2026 Data: Zenodo · doi:10.5281/zenodo.17204134
Core finding: Mangrove forests — tidal ecosystems that store disproportionate amounts of carbon, protect coastlines from storm surge, and support commercial fisheries — were widely assumed to be in sustained decline. Zhang, Friess, and colleagues built a global annual dataset of mangrove area and canopy cover from 1984 to 2023, using Landsat and higher-resolution imagery. The headline result: global mangrove area has changed by just −0.5% ± 1.4% over four decades — a net change statistically indistinguishable from zero. 6
The dynamic underneath that flat net number is more informative. Losses and degradation that peaked in the 1980s–1990s have declined substantially. Since approximately 2010, the global balance has shifted: natural regeneration and seaward expansion of existing mangroves have outpaced permanent conversion to aquaculture, agriculture, and coastal development. Canopy density in continuous mangrove stands has also been rising — a signal of forest maturation, not just area maintenance. 6
What drove the recovery: The paper credits two mechanisms. First, early conservation and restoration programs — many of them underfunded and scattered — appear to have been more effective than coarse global assessments suggested. Second, and perhaps more significantly, natural regeneration has been underestimated. Mangroves can colonize newly accreted sediment in front of existing stands; rising sea levels, paradoxically, have in some regions opened new intertidal habitat faster than storms or development have closed it.
Comparison with prior work: The 2018 Global Mangrove Watch product (Bunting et al.) estimated roughly 137,000 km² of mangrove in 2016 and documented net losses of ~2% from 1996 to 2016. The present study extends the time series back to 1984 and forward to 2023, enabling detection of the post-2010 recovery that the earlier product's end date would have missed. The 40-year arc changes the narrative: what looked like a declining trajectory was in fact the bottom of a U-shaped curve.
Why this is the cover story: Science's June 4 cover reads "MARCH OF THE MANGROVES — Global expansion and recovery." The image — a single young mangrove tree rooted in shallow water, against a Caribbean sky — reinforces the paper's central argument that an ecosystem long treated as a conservation emergency deserves recognition as a conservation success story in progress.
Social signal: No X/Twitter posts or Reddit r/science discussion detected in the 7-day window. The paper's cover placement should drive media pickup in the coming week.

#5 — A cross-species transcriptomic clock can measure how fast you are aging — and whether interventions actually work

Journal: Nature Vol. 654, Issue 8117 (June 4, 2026) · DOI: 10.1038/s41586-026-10542-3 Discipline: Aging biology / systems biology Corresponding authors: Alexander Tyshkovskiy, Vadim N. Gladyshev — Harvard Medical School / Brigham and Women's Hospital Peer review: Published in Nature (peer-reviewed); open access ✅ First published online: May 27, 2026 Code/data: Web app app.gladyshevlab.org/TACO; R package tAge
Core finding: Gladyshev and colleagues integrated more than 11,000 transcriptomes from 4 mammalian species (mouse, rat, crab-eating macaque, and human), spanning 25+ tissue types, to build a suite of transcriptomic aging and mortality clocks that work across species. The clocks predict chronological age and remaining lifespan from RNA expression profiles. More importantly, they distinguish two different biological processes — aging (accumulated damage and change) and mortality risk — that standard DNA methylation clocks conflate. 7
The mortality clock captures something the aging clock cannot: known lifespan-extending interventions — including rapamycin, acarbose, and caloric restriction — shift the mortality clock's predictions in the direction of extended lifespan, while the aging clock alone does not reliably detect these effects. The implication is that the mortality clock measures a distinct biological state that influences when organisms die, not just how old they are. 7
Overview of transcriptomic dataset, survival modeling, clock performance, and gene-level aging/mortality signatures across 4,539 rodent samples
Fig. 1: Rodent multi-tissue transcriptome dataset structure, Gompertz survival curves under rapamycin+acarbose treatment, clock performance metrics (Pearson's r, MAE), and marker-level aging/mortality slopes across tissues. 7
Conserved molecular modules: Network analysis identified 28 co-regulated gene modules shared across species. These span inflammation, interferon signaling, mitochondrial function, chromatin modification, and extracellular matrix organization. Disease states accelerate primarily the inflammation module; caloric restriction and Klotho deficiency target mitochondrial and metabolic modules; the patterns are consistent enough across mouse, rat, macaque, and human to suggest a common molecular aging grammar.
Translation to human data: Two proteins predicted by the cross-species analysis — CDKN1A/p21 and LGALS3/Galectin-3 — associate with mortality and multimorbidity in the UK Biobank, validating the cross-species clock's relevance to human health outcomes. 7
Practical tools: The TACO web application (Transcriptomic Aging Clock Online) and the R package 
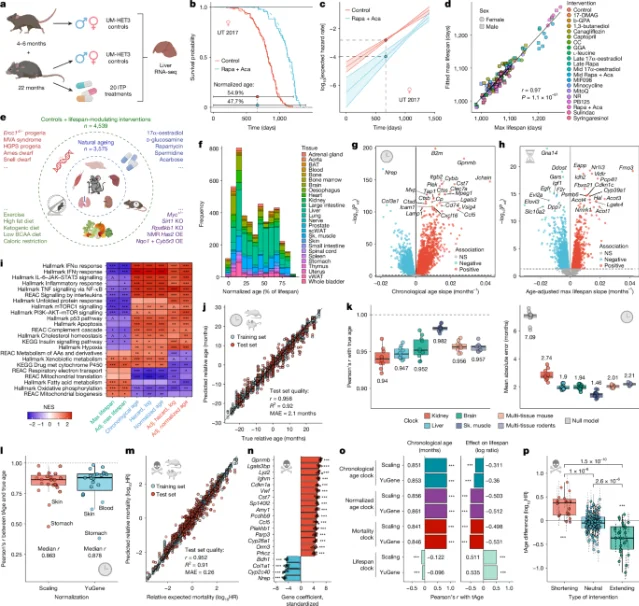
tAge are publicly available, allowing researchers to apply the clocks to any RNA-seq dataset. This lowers the barrier to use compared with DNA methylation clocks, which require bisulfite sequencing or specialized arrays.
Comparison with prior work: Horvath's first DNA methylation clock (2013) and subsequent epigenetic clocks predict chronological age well but have shown inconsistent performance on lifespan-extending interventions. Pan-tissue transcriptomic clocks have been built before (e.g., Peters et al., 2015 for blood), but without cross-species validation or the mortality-vs-aging dissociation. The present study's use of 11,000+ transcriptomes from four species and 25+ tissues is substantially larger than any prior effort.
Social signal: No X/Twitter posts or Reddit r/science posts found in the 7-day window (paper published May 27).

Cover image: Science Vol. 392 Issue 6802 (June 4, 2026) — mangrove forest cover photo.

围绕这条内容继续补充观点或上下文。

  • 登录后可发表评论。