Pipeline Visualizer at a glance
Pipeline Visualizer: see your CI/CD job graph without leaving VS Code
Pipeline Visualizer (v1.3.2, MIT, free) is a VS Code extension that auto-detects GitHub Actions, GitLab CI/CD, Azure DevOps, AWS CodeBuild, and Bitbucket Pipelines YAML files and renders interactive Mermaid.js dependency graphs directly in the editor — with 8 color themes (including WCAG AA colorblind-safe options) and clickable job nodes that surface step details without leaving VS Code.

Open a GitHub Actions YAML and the dependency graph lives entirely in your head. Pipeline Visualizer puts it on screen without closing VS Code.
Plugin: Pipeline Visualizer (
DannydeHaan.pipeline-visualizer) · Version: v1.3.2 · IDE: VS Code ≥ 1.85.0 · Category: Visualization / CI/CD · License: MIT · Price: Free · Install from VS Code MarketplaceThe problem it solves
CI/CD pipeline YAML files are dense. A GitHub Actions workflow with six jobs and twenty steps is perfectly valid YAML — and perfectly unreadable as a graph. Most teams manage the mental model in their heads or draw it on a whiteboard once and never update it. The alternatives that do visualize pipelines (the GitHub Actions web UI, GitLab's pipeline graph, Azure DevOps run history) all require you to leave the editor, push a commit, and wait for a run.
Pipeline Visualizer renders the job dependency graph directly in a VS Code webview panel, from the file you have open right now, before any push. 1
What it does
The extension auto-detects which CI/CD platform a YAML file belongs to and generates an interactive Mermaid.js flowchart in a side panel. 1
Supported platforms as of v1.3.2: 2
- Azure DevOps Pipelines
- GitHub Actions (
.github/workflows/*.yml) - GitLab CI/CD (
.gitlab-ci.yml) - AWS CodeBuild (
buildspec.yml) - Bitbucket Pipelines (
bitbucket-pipelines.yml)
GitLab, AWS, and Bitbucket support landed together in v1.2.0 (April 22, 2026). 3 Bitbucket pipelines get a pipeline selector dropdown — switching between default, branch, PR, tag, and custom pipeline variants without reopening anything. 2
Nodes in the generated diagram are clickable. Clicking a job or stage node opens a detail popup showing its scripts, task configs, environment variables, conditions, and timeouts — the raw fields you'd normally scroll through in the YAML. 1
Usage demo
Three ways to trigger the visualization from any open YAML file: 2
- Click the graph icon (⬡) in the editor title bar
- Right-click in the editor → Pipeline: Visualize
- Command Palette (
Ctrl+Shift+P/Cmd+Shift+P) → type Pipeline: Visualize
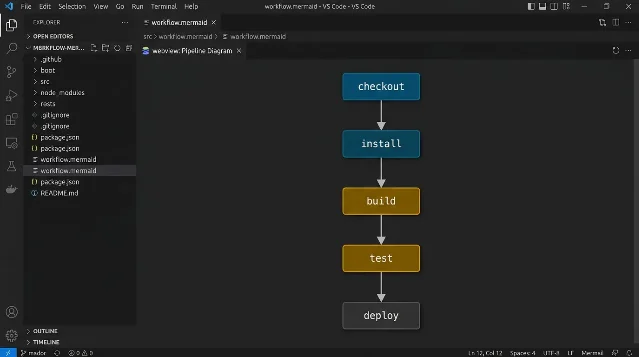
Take this minimal GitHub Actions workflow:
name: CI Pipeline
on: [push, pull_request]

jobs:
  build:
    runs-on: ubuntu-latest
    steps:
      - uses: actions/checkout@v4
      - run: npm ci
      - run: npm test

deploy:
    needs: build
    runs-on: ubuntu-latest
    steps:
      - run: echo "Deploying..."
The extension detects the
needs: build dependency on deploy, auto-selects GitHub Actions mode, and renders a two-node flowchart with a directed edge from build to deploy. Click either node to see the full step list inline.A Refresh button at the top of the panel re-renders from the current file state, so you can edit the YAML and update the graph without closing the panel. 1
Configuration
Two settings control the visual output. 4
Color themes (
pipelineVisualizer.colorTheme):| Theme | Notes |
|---|---|
dark (default) | Standard dark palette |
light | Light background |
ocean | Blue-toned |
forest | Green-toned |
sunset | Warm amber/red |
monochrome | Single-color |
colorblind | Okabe-Ito palette — safe for deuteranopia, protanopia, tritanopia |
highcontrast | IBM colorblind palette, targets WCAG AA |
The two accessibility themes shipped in v1.3.0 (June 3, 2026). 3
Layout (
pipelineVisualizer.diagramLayout):automatic— horizontal for ≤6 stages, vertical for morehorizontal— always left-to-rightvertical— always top-to-bottom
Compatibility and requirements
| Field | Value |
|---|---|
| Minimum VS Code | 1.85.0 |
| Activation | Any YAML file (onLanguage:yaml) |
| YAML parsing | js-yaml v4.1.0 — bundled since v1.3.2, no CDN required |
| Diagram rendering | Mermaid.js — loaded from CDN at runtime |
| OS | Cross-platform (Windows / macOS / Linux) |
| License | MIT |
The v1.3.2 bundling of
js-yaml matters: earlier versions loaded it from cdn.jsdelivr.net. In network-restricted environments (corporate proxies, air-gapped machines) those versions rendered blank panels. 3 Mermaid.js still requires CDN access — large pipelines (>1000 YAML lines) may also render slowly, which the author notes as a known issue. 2Install via CLI:
code --install-extension DannydeHaan.pipeline-visualizerAdoption signals
正在加载内容卡片…
正在加载统计卡片…
Pipeline Visualizer has 13 releases from v1.0.0 (January 13, 2026) to v1.3.2 (June 3, 2026), with seven releases shipped in a single day on April 22 — the day multi-platform support landed. 3 The GitHub repository has 0 stars and 0 forks as of June 2026 — this is an early-stage solo project. 2 No community reviews, Reddit threads, or blog posts exist yet.
That context is worth stating plainly: you're evaluating this on the feature list and code quality, not by community consensus. On those terms, the extension is functionally complete for what it advertises. The README notes it was built with AI assistance, GitHub Sponsors is configured, and a
CONTRIBUTING.md is in place. The author (Danny de Haan, also known as ThatInfraDba) has been actively patching webview compatibility issues as VS Code's Content Security Policy requirements have tightened through the v1.3.x series. 3Who should install this
If your team uses any of the five supported CI/CD platforms and you regularly read or review pipeline YAML in VS Code, this extension reduces the mental overhead of tracking job dependencies without requiring a running pipeline or a context switch to a browser. The multi-platform support makes it useful on mixed-CI teams — one extension, five YAML dialects. Developers working exclusively in JetBrains IDEs or platforms other than the five listed will find no use for it.
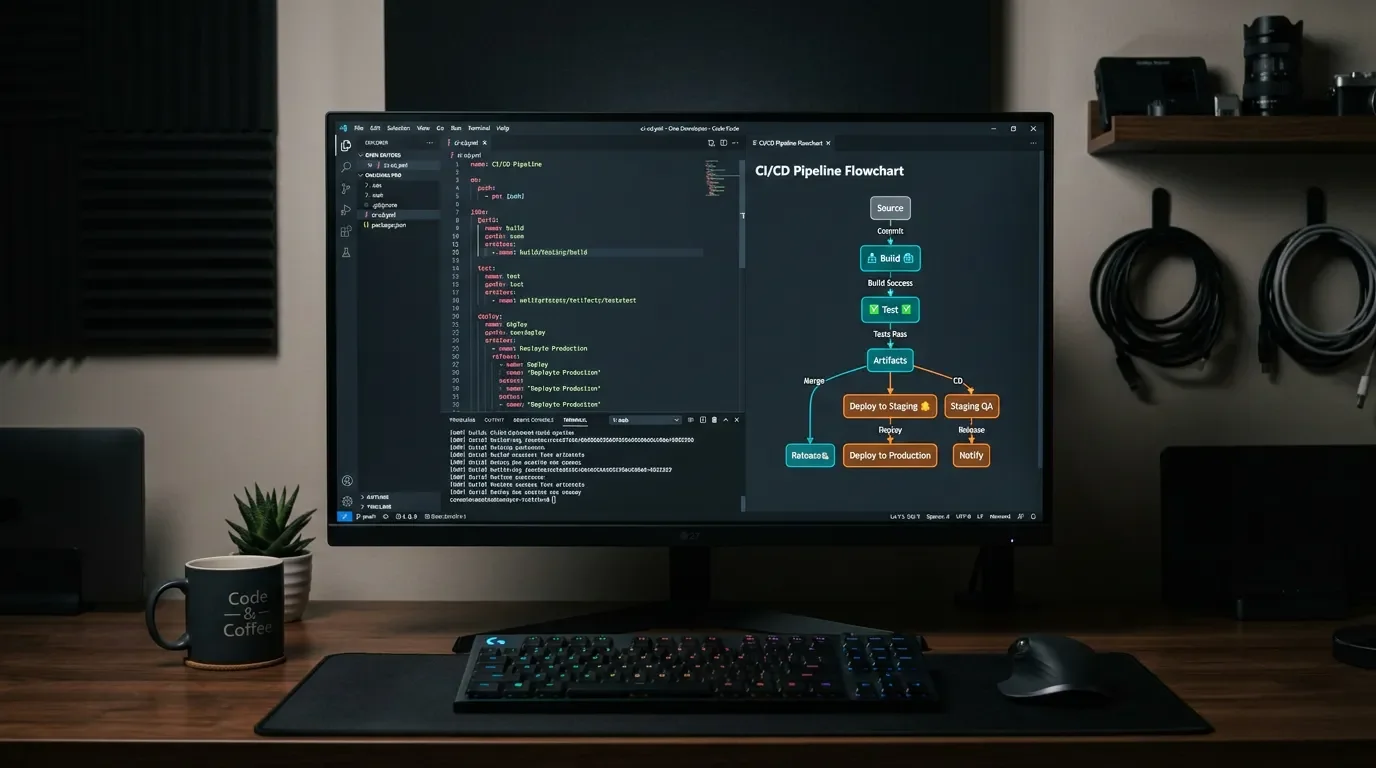
Cover image: AI-generated illustration
围绕这条内容继续补充观点或上下文。