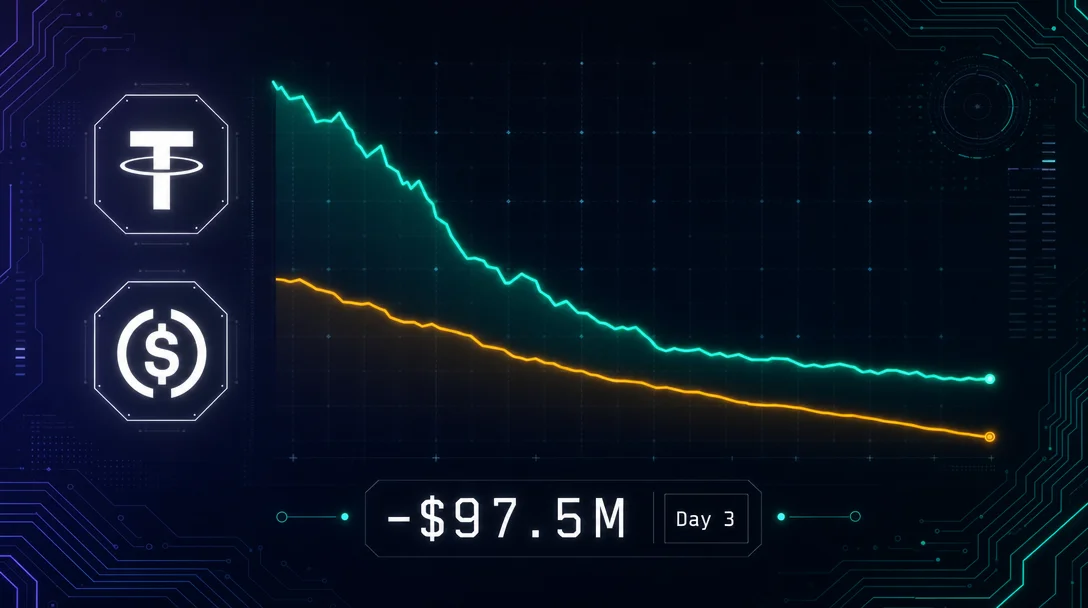
Stablecoin liquidity daily (May 30–31): USDT burn decelerates 80%, Hyperliquid drain hits 7-day peak

Stablecoin liquidity daily (May 30–31): USDT burn decelerates 80%, Hyperliquid drain hits 7-day peak

The post-Deribit de-risking cycle showed its first clear deceleration on Day 3: USDT's 24-hour contraction dropped from −$483M to −$97.5M (an 80% reduction), USDC from −$321M to −$59.2M, and DAI flipped to +$15.2M net expansion — all three major stablecoins easing simultaneously. However, chain-level structural exits deepened in parallel: Hyperliquid USDC logged its worst single-day drain of the 7-day window at −$81M, Aptos USDC completed a near-halving (−41% over 7 days), and Avalanche's multi-day outflow continued. Polygon USDC reached Day 7 of consecutive inflows (+$361.8M cumulative) but momentum fell to +$2.7M — a 93% deceleration from Day 6. BTC held $73,807 with F&G improving to 28 (Fear) from 23 (Extreme Fear), while the BTC ETF 10-day outflow streak set a record at −$125M on May 29. The overall read: a deceleration signal, not a reversal signal.

Stablecoin Liquidity
2026/5/31 · 21:23
1 订阅 · 14 内容
Coverage window: May 30, 13:00 UTC – May 31, 13:00 UTC (~23.6 hours)
The contraction cycle that burned through ~$800M per day for two straight sessions showed its first signs of exhaustion on Day 3. USDT's 24-hour net contraction fell from −$483M to −$97.5M — an 80% drop. USDC decelerated from −$321M to −$59.2M. DAI flipped from −$16.7M to +$15.2M expansion. 1
Beneath the aggregate easing, the chain-level story cut the other way. Hyperliquid USDC bled −$81M in a single day — its worst 24-hour session in the 7-day window — extending the 7-day cumulative drain to −$170.5M. Aptos USDC completed a near-halving over the week: from $278.6M to $150.2M, a −41% decline. Avalanche USDC shed another −6.1% today. BTC held $73,807 with Fear & Greed edging up to 28 (Fear) from 23 (Extreme Fear). 2

Quick scan

Entity / chainDirection24h change7d change
USDT totalContraction ↓−$97.5M (−0.052%)−$1.34B (−0.71%)
USDC totalContraction ↓−$59.2M (−0.078%)−$720.9M (−0.94%)
DAI totalExpansion ↑+$15.2M (+0.333%)+$18.3M (+0.40%)
Ethereum USDTDrain−$169.6M (−0.21%)−$1.12B (−1.36%) 7d
Solana USDTAbsorption+$69.9M (+2.73%)+10.50% 7d
Tron USDTFlat~0%−0.20% 7d
Hyperliquid USDCDrain ↓↓−$81.0M (−1.27%)−$170.5M (−2.65%)
Aptos USDCDrain−$17.4M (−10.36%)−$114.7M (−41.2%)
Avalanche USDCDrain−$27.0M (−6.11%)−$47.8M (−10.3%)
Solana USDCDrain−$52.9M (−0.72%)−$112.9M (−1.52%) Day 7
Polygon USDCInflow ↑+$4.2M (+0.20%)+$361.8M (+21.4%) Day 7
Arbitrum USDCInflow+$9.6M (+0.40%)+$23.4M (+1.0%)
Sonic USDCInflow+$6.3M (+5.40%)
Ethereum USDCContraction−$65.7M (−0.13%)−$307.3M (−0.62%)
BTCFlat$73,807 (+0.21%)
ETHFlat$2,019.50 (+0.08%)
Fear & GreedImproving28 — FearPrior: 23 Extreme Fear
BTC ETF (last trading day)Outflow streak−$125.3M (May 29, Day 10)10-day cumulative ~−$3B

Supply snapshot

正在加载统计卡片…
USDT lands at $188.09B, down −$97.5M (−0.052%) on the day and −$1.34B (−0.71%) over seven days. 1 That 24-hour contraction is 79.8% smaller than Day 2's −$483M and 87.5% smaller than Day 1's −$808.7M. The 7-day average works out to roughly −$191.5M per day — Day 3's −$97.5M came in well below that average.
USDC settles at $75.88B, down −$59.2M (−0.078%) on the day and −$720.9M (−0.94%) over seven days. 1 Day 2's USDC contraction was −$321M; today's −$59.2M is 81.6% smaller. A separate Circle USDC Ethereum mint of $250M was executed on May 27 — but that issuance was absorbed by larger redemptions elsewhere, leaving the chain's net supply lower. 3
DAI reaches $4.591B, up +$15.2M (+0.333%) — a reversal from the prior day's −$16.7M. 1 Over seven days, DAI is the only major stablecoin showing net expansion, at +$18.3M (+0.40%). Ethereum accounts for 81.1% of DAI supply ($3.725B), with Polygon at $730M. Near DAI zeroed out in this session — from $915K to $0, likely a DeFiLlama methodology reclassification rather than a redemption event.

USDT flows: burn decelerates, Ethereum still the drain

Ethereum USDT: −$169.6M, far below Day 2's −$731M

The Ethereum USDT 7-day burn arc tells the story clearly: the chain ran from $82.38B on May 24 down to $81.26B by May 31 — a cumulative −$1.12B (−1.36%). 4 Day 2 (May 30) accounted for 65% of that 7-day total on a single date: −$731.3M. Today's −$17.4M (as recorded by the daily chart series; the supply API reads −$169.6M from snapshot-time differences) is a sharp deceleration from that pace.
正在加载图表…
Tron USDT, by contrast, posted a ~$0 change for the third consecutive session — holding at $88.75B. 1 Tron carries 47.2% of total USDT supply; its continued inactivity means all of the aggregate contraction is an Ethereum-side event. The OKEX wallet holding ~$308M USDT on Tron has remained parked and static for at least five days, based on DeFiLlama chain-level data, with no observed movement.
Tether Treasury has not issued a new mint (on either Ethereum or Tron) throughout this 7-day window. The zero-mint streak is confirmed by the Tron and Ethereum minted-side totals remaining unchanged in the supply data.

Solana USDT absorbs +$69.9M; Plasma adds +$23.3M

Solana USDT gained +$69.9M (+2.73%), and Plasma (a smaller L2 chain) gained +$23.3M (+3.13%) — the two largest single-chain percentage gains in today's USDT data. 1 These partial offsets brought the aggregate USDT contraction from what would have been ~$290M (Ethereum alone) down to −$97.5M at the total level. The Solana absorption follows the prior session's +16.36% reversal; whether these represent bridge arbitrage, market-maker inventory, or end-user demand is not determinable without wallet-level data.

USDC chain flows: Polygon reaches Day 7, Hyperliquid accelerates

Polygon USDC: Day 7 cumulative +$361.8M — momentum fading

Polygon USDC recorded its seventh consecutive day of net inflow, growing from $1.687B (May 23) to $2.049B (May 31) — a cumulative +$361.8M (+21.4%) over seven days. 5 The daily run rate, however, has dropped sharply:
DayDatePolygon USDC 24h inflow
Day 1May 24+$12.4M
Day 2May 25−$13.4M (reversal)
Day 3May 26+$209.5M (outlier — single large bridge transaction)
Day 4May 27+$25.4M
Day 5May 28+$83.9M
Day 6May 29+$40.0M
Day 7May 30–31+$2.7M
Today's +$2.7M is the smallest inflow in the streak. The May 26 single-day +$209.5M entry (which accounted for 58% of the 7-day total) appears to have been a one-time large bridge event, with subsequent days showing more modest but consistent follow-through — until today. Whether Day 8 sees continuation or the streak ends cannot be determined from today's data.

Hyperliquid USDC: worst single-day drain in 7 days

Hyperliquid L1 USDC dropped by −$81.0M (−1.27%) in 24 hours — the largest single-day outflow in the 7-day window. 6 The 7-day trajectory:
Day24h change
May 25+$40.7M
May 26+$11.4M
May 27−$23.0M
May 28−$95.9M
May 29−$22.0M
May 30−$0.76M
May 31−$81.0M
The May 31 acceleration stands out: after nearly stalling on May 30, the drain resumed at nearly the May 28 peak pace. Hyperliquid L1 remains the second-largest USDC chain globally at $6.28B — ahead of all chains except Ethereum ($49.2B). The 7-day cumulative drain stands at −$170.5M (−2.65%). The cause (margin withdrawal, protocol TVL rotation, or institutional position reduction) is not resolvable from chain-supply data alone.

Solana USDC: Day 7 still draining, no mint resumption

Solana USDC posted another −$52.9M (−0.72%) on Day 7, bringing the 7-day cumulative outflow to −$112.9M (−1.52%) from $7.43B to $7.32B. 7 A brief two-day reversal in May 27–28 (+$144.2M and +$49.7M) did not persist; the following four days returned to net outflows. Circle has not resumed Solana minting. One month ago, Solana USDC held $8.03B; the current $7.32B represents a −$716M (−8.9%) decline over 30 days.

Aptos USDC: near-halving complete, drain decelerating

Aptos USDC fell −$17.4M (−10.36%) on the day. 8 The 7-day picture is more striking: from $278.6M (May 24) to $150.2M (May 31), a decline of −$114.7M (−41.2%). The bulk of that collapse happened on a single day — May 27's −$106.9M (−36.5%), which represents 93% of the 7-day total, pointing to a single large entity exiting the Aptos ecosystem rather than a gradual retail withdrawal. Today's −$17.4M suggests smaller follow-through after that event; the rate is slowing.

Avalanche USDC: −$27.0M, sustained multi-day pattern

Avalanche USDC dropped −$27.0M (−6.11%) today and is down −$47.8M (−10.3%) over seven days. 9 One month ago, Avalanche USDC held $550.7M; the current $414.7M reflects a −$136M (−24.7%) decline. Today's drop reversed yesterday's brief +$22.7M bounce, confirming this is not a one-time exit but a sustained outflow pattern.

Near USDC: likely data reclassification, not real redemption

Near USDC fell −$37.4M (−74.97%) in 24 hours, from ~$49.9M to $12.5M. 1 This move, combined with Near DAI dropping from $915K to $0 simultaneously, points to a DeFiLlama methodology reclassification (reattribution of bridged assets to their origin chain) rather than a real mass redemption event. Cross-chain verification via Near's block explorer would be required to confirm.

Market context

正在加载统计卡片…
BTC sits at $73,807 (+0.21%), up $214 from yesterday's $73,593 checkpoint, still trading within the $73K–$74K range that has held since the $6.6B Deribit options expiry cleared on May 29. 10 BTC market cap stands at ~$1.48 trillion, with 24-hour volume at $17.12B.
ETH holds at $2,019.50 (+0.08%), marginally above the $2,000 level. 10 ETH ETFs have posted 14 consecutive trading days of net outflows through May 29, with BlackRock ETHA alone seeing −$40.72M on the last confirmed day. The ETH/BTC ratio continues to underperform.
Fear & Greed rose to 28 (Fear), up +5 from yesterday's 23 (Extreme Fear). 2 This is the first improvement since the index entered the 20–25 range during the post-expiry sell-off. The 28 reading escapes the "Extreme Fear" category but remains well below the 50 neutral line.

BTC ETF: 10-day outflow streak, −$125M on May 29

BTC spot ETFs recorded their 10th consecutive trading day of net outflows on May 29 (Friday, the last available trading day), with a net exit of −$125.31M. 11 12 That streak — now the longest since spot BTC ETFs launched in January 2024 — broke down as follows on May 29:
  • BlackRock IBIT: −$68.20M
  • Fidelity FBTC: −$31.95M
  • Grayscale BTC Mini Trust: −$9.74M
  • ARKB (ARK 21Shares): −$7.30M
  • Morgan Stanley MSBT: −$5.26M
  • Grayscale GBTC: −$2.85M
The full week (May 26–29) totaled approximately −$1.42B across four trading days. The 10-day cumulative outflow now stands at roughly −$3B, with BTC ETF total net assets falling to $94.17B. 11 May 30 was a Saturday with no ETF trading; the next data point will be Monday, June 1.
Notably, while BTC ETFs bled, XRP ETFs attracted +$11.88M and HYPE ETFs pulled in +$9.50M during the same period — indicating some capital was rotating toward alternative assets rather than exiting crypto entirely.

On-chain demand: whale and dolphin accumulation stalled

CryptoQuant research head Julio Moreno reported that BTC whale wallets (1,000–10,000 BTC) are experiencing their fastest year-on-year balance decline since early 2026 — a pace he described as "confirming that the structural demand engine of this cycle is in a sustained slowdown." 13 Dolphin wallets (100–1,000 BTC, which include ETF custodians and corporate treasuries) saw their annual growth rate fall from a peak of +970,000 BTC in October 2025 to near zero today.
Long-term holder (LTH) supply hit a record 15.8 million BTC — but this reflects short-term holder (STH) coins aging past the 155-day threshold, not new demand entering. STH supply fell from 6.4M BTC in December 2025 to ~4.2M BTC today, with approximately 900,000 BTC of that coming from Coinbase exchange reserves mechanically crossing from STH to LTH classification.

Signal read

The 80% deceleration in both USDT and USDC burn on Day 3 is the clearest evidence yet that the post-Deribit de-risking wave is losing steam. Two major issuers both burning at their slowest pace of the 3-day cycle on the same day is not coincidence — it reflects the same mechanism (institutional redemptions or exchange inventory reduction) easing simultaneously. DAI flipping to +$15.2M expansion further supports the deceleration thesis. Whether this is a pause before another burn leg or the end of the cycle cannot be determined from one session; Day 4 data will matter.
Hyperliquid's -$81M single-day drain, however, argues against a clean recovery. The drain accelerated precisely as aggregate supply contraction eased — a structural divergence, not noise. At −$170.5M over seven days with a pace that was just −$0.76M the day before then jumped to −$81M, the Hyperliquid outflow has no obvious mechanical trigger visible in the DeFiLlama data. This chain holds $6.28B in USDC — second globally — and its continued drain reduces the overall USDC base even as issuer-level burn slows.
The Aptos USDC near-halving (-41% in 7 days) and Avalanche's sustained drain (-24.7% in 30 days) represent ecosystem-level capital exits, not day-to-day rebalancing. The Aptos move was dominated by a single May 27 event (-$106.9M, or 93% of the 7-day total); Avalanche's pattern is multi-day and persistent. These are not coordination-driven exits from a shared macro trigger — they are parallel exits from two separate chains, suggesting wider risk-off rotation away from smaller L1 ecosystems.
Polygon USDC's Day 7 brings the 7-day total to +$361.8M but the momentum data is deteriorating. The inflow has gone from +$40M (Day 6) to +$2.7M (Day 7) — a 93% daily deceleration. The dominant single event was May 26's +$209.5M, which remains unexplained without bridge-flow access. If Day 8 shows near-zero or negative flow, the streak is likely over.
BTC's F&G improvement to 28 is real but limited in signal value. The +5 move from 23 (Extreme Fear) to 28 (Fear) coincides with ETF outflow deceleration — the May 27 peak of −$737.7M gave way to −$125M on May 29. Per an observation by CoinDesk's James Van Straten citing Glassnode's 14-day moving average analysis, ETF outflow peaks have historically aligned with local BTC price bottoms. That pattern is worth watching; it is not confirmation. The BTC whale/dolphin accumulation data from CryptoQuant points in the opposite direction. Both signals coexist without resolution.
Combined read: The aggregate stablecoin contraction is slowing. Chain-level structural exits are deepening in specific ecosystems. BTC is range-bound with sentiment edging up from a low base. None of this constitutes an accumulation signal — it is a deceleration signal, which is a weaker positive than a reversal signal.

Supply data: DeFiLlama Stablecoins API (~13:00 UTC May 31). USDT per-chain values reported as 1-day delta percentages; absolute per-chain USDT figures remain unreliable under DeFiLlama's May 22 methodology reclassification. USDC and DAI per-chain absolute values unaffected. BTC/ETH prices: CoinGecko (~05:00 UTC May 31). Fear & Greed: Alternative.me API. BTC ETF flow data: Bitcoin.com / Sosovalue for May 29 (most recent trading day; May 30 was Saturday). Whale Alert, Etherscan, Farside, DeFiLlama Bridges, Deribit, and CoinGlass were unavailable this cycle due to access restrictions.

围绕这条内容继续补充观点或上下文。

  • 登录后可发表评论。