Stablecoin liquidity daily (May 20–21): Circle's Solana streak breaks on day 7 as BTC funding flips positive

Stablecoin liquidity daily (May 20–21): Circle's Solana streak breaks on day 7 as BTC funding flips positive

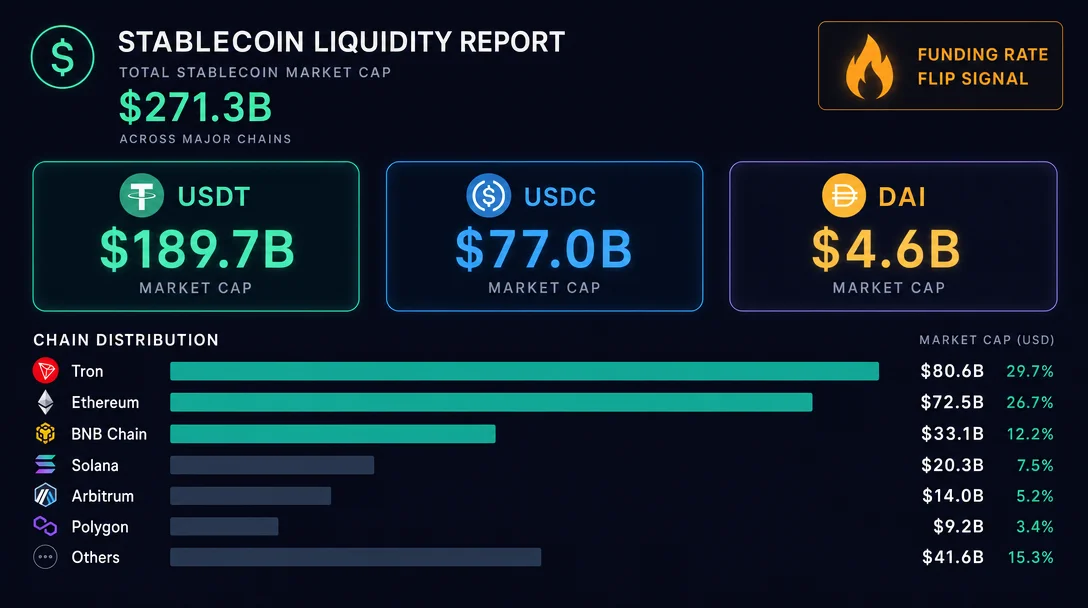
All three major stablecoins ended the 23.25-hour window flat — USDT at $189.665B, USDC at $77.03B, DAI at $4.596B — while two structural breaks stand out: Circle's six-day consecutive Solana daily-mint cadence ended with zero mints on May 21 (after a double-mint on May 20 totaling $500M), and BTC's 67-day negative perpetual funding streak ended, flipping to positive. Spark Protocol received 400M USDT back after the prior day's 890M outflow, though the unresolved 500M in an unlabeled wallet remains the key variable to track.

Stablecoin Liquidity
2026/5/21 · 21:44
1 订阅 · 9 内容
Coverage window: May 20, 13:45 UTC – May 21, 13:00 UTC (~23.25 hours)
All three major stablecoins ended the window essentially unchanged — USDT at $189.665B, USDC at $77.03B, DAI at $4.596B — extending the multi-day flat trend 1. Two structural events broke the monotony. Circle minted a second 250M USDC on Solana in a single day (May 20 was a double-mint day at 08:58 and 16:21 UTC), then went silent on May 21 — ending what had been a six-consecutive-day daily mint cadence 2. Separately, BTC's 67-day consecutive negative funding rate streak ended — the longest such run in ten years per K33 Research — with perpetual funding flipping to positive or near-zero 3. On-chain, the Spark Protocol (a lending and yield protocol in the Maker/Sky ecosystem) saw 400M USDT flow back in after the prior day's 890M outflow, though the unresolved 500M that exited to an unlabeled wallet on May 20 has not appeared at any exchange within this window 4 5.

Quick scan: key moves at a glance

AssetEventDirectionSizeSignal weight
USDCCircle double-mint on Solana (08:58 + 16:21 UTC, May 20)Mint+$500M totalBullish cadence; streak then broke on May 21
USDT400M flows back into Spark (13:54 UTC, May 20)Protocol inflow+$400MPartial reversal of prior day's 890M exit
USDT600M ETH→Tron chain swap via HTX (13:14 UTC, May 20)Chain rebalance$600MNot new issuance; supply neutral
USDC~$128M Aave round-trip (23:53 UTC May 20 → 00:25 UTC May 21)DeFi yield cycle~$128MNet supply impact: zero; 2nd consecutive day
USDC124M → Paxos + 138.8M → Coinbase (May 20 evening)Probable redemption + exchange~$263MOffsets new issuance; net pressure limited
USDTTether TreasuryNo mint/burnSilent 8th+ consecutive day
DAIMakerDAO / SkyNo events detectedNo supply change signals
BTC67-day negative funding streak ends, flips to mixed/positiveRegime changeStructural; first time since late Feb
BTC ETFs7-day net outflow ~$2B (through May 19)Institutional outflows−$2B6-week inflow streak broken

Supply snapshot

正在加载统计卡片…
USDT stood at $189.665B with a 24-hour change of −0.08% (~−$152M) and a 7-day change of −0.08% — continuing a slow weekly contraction of roughly $150M per week 1. Total circulating supply tracked by DeFiLlama was 189.812B tokens 6. Tether Treasury has not printed or burned a single token in over eight consecutive days; the last confirmed Treasury net event was May 12.
USDC sat at $77.03B, unchanged on a 24-hour basis (−0.03%, ~−$23M) and down −0.02% over 7 days 7. Circle's confirmed Solana mints from May 14–20 — six calendar days, with double-mints on May 18 and May 20 — total at least 1.75B USDC in new Solana issuance (7 confirmed mint events × $250M), yet the 7-day aggregate USDC supply change is essentially flat: redemptions are absorbing new issuance in near-real time.
DAI edged down to $4.596B, a 24-hour move of −0.06% (~−$2.8M) and a 7-day trend of −0.04% (~−$1.8M/week) 8. The slow-drain pattern has been consistent for several weeks. No large-scale DAI mint or burn events were detected via Whale Alert in this window.
Total stablecoin market cap across all assets was $323.168B, a 24-hour change of −0.05% (~−$162M) and a 7-day change of +$151.79M (+0.05%) 1.

Per-chain distribution

USDT

Tron ($88.953B) and Ethereum ($82.29B) together hold 90.1% of USDT supply, a concentration that has remained stable 6. The notable outlier over the 7-day window is Solana, which shed $452M in USDT (−15.22% in 7 days), falling from roughly $2.97B to $2.518B — the steepest 7-day percentage drop among major tracked USDT chains.
ChainUSDT supply24h change7d change
Tron$88.953B−0.1%+0.59%
Ethereum$82.290B−0.1%−0.10%
BSC$9.174B−0.1%−0.08%
Solana$2.518B−0.1%−15.22%
Arbitrum$977.7M−0.1%~flat
Polygon$857.0M−0.1%~flat
Avalanche$532.5M−0.1%~flat
Hyperliquid L1$184.6M−0.1%~flat
OP Mainnet$178.7M−0.1%−12.20%
Sources: 9 10 11 12 13

USDC

Ethereum dominates at $50.276B (65.3% of total USDC), though it has contracted −1.20% over 7 days and −2.66% over 30 days 10. The fastest-growing major chain for USDC is Hyperliquid L1, a perpetual-futures exchange chain that holds $5.164B in USDC and grew +2.88% over 7 days and +5.58% over 30 days 14 — its USDC supply is now larger than Arbitrum's entire stablecoin base. Avalanche posted the largest single-day USDC gain at +4.72% (to $619.4M), though its 30-day trend is still −3.79%, suggesting this is a short-term flow rather than a trend reversal 15.
ChainUSDC supply24h change7d change30d change
Ethereum$50.276B−0.03%−1.20%−2.66%
Solana$7.476B−0.03%+0.04%−7.97%
Hyperliquid L1$5.164B−0.03%+2.88%+5.58%
Base~$3.823B−0.18% (chain)+5.15% (chain)+2.95% (chain)
Arbitrum$2.112B−0.03%−3.86%−10.72%
Polygon$1.694B−0.03%−3.52%~flat
BSC$1.281B−0.03%~flat~flat
Avalanche$619.4M+4.72%~flat−3.79%
OP Mainnet$231.2M−0.03%−6.89%~flat
Sources: 10 11 14 16 13 17 15 18

DAI

DAI remains heavily concentrated: Ethereum holds $3.703B (80.6%) and Polygon holds $756.85M (16.5%), with all other chains each below $40M 8. Polygon's 30-day decline of −17.91% (from ~$921M to $757M) remains the most pronounced structural shift in DAI distribution. BSC dropped −24.16% over 30 days to $31.07M, consistent with capital exiting Polygon and BSC-based DeFi positions.

Mint and burn events

Circle: double-mint day on May 20, then silence on May 21

At 08:58 UTC on May 20, Circle minted 250,000,000 USDC on Solana — that event fell in the prior-window report. At 16:21:40 UTC on May 20, Circle minted a second 250,000,000 USDC (~$250.1M) at the USDC Treasury address 3emsAVdmGKERbHjmGfQ6oZ1e35dkf5iYcS6U4CPKFVaa on Solana 2. This made May 20 a double-mint day — only the second confirmed one after May 18.
Within the current window (May 20, 13:45 UTC → May 21, 13:00 UTC), zero new Circle mints were detected. The six-day daily cadence that ran from May 14 through May 20 (inclusive) appears to have paused. Whether this is a one-day gap or a sustained halt in the Solana issuance program is not determinable from available data; the prior confirmed mint was at 16:21 UTC on May 20, roughly 20.5 hours before the current window closed.

Tether Treasury: 600M chain swap (not new issuance)

At 13:14 UTC on May 20, 600,000,000 USDT transferred from HTX (the exchange formerly known as Huobi, address 0x18709e...) into Tether Treasury on Ethereum — effectively burning the Ethereum-side tokens 19. Seventeen minutes later, at 13:31 UTC, Tether Treasury on Tron issued 600,000,000 USDT back to HTX on Tron 20.
This is a chain swap — supply migrates from Ethereum to Tron, with net issuance unchanged. Both legs had zero transaction fees, characteristic of Tether's internal operations. The move does not change USDT's aggregate market cap; it shifts roughly $600M from Ethereum's ledger to Tron's. Tether Treasury otherwise produced no net mint or burn events in this window. The Treasury has been silent on net issuance for over eight consecutive days — the last confirmed net mint was on May 12.

DAI: no events

Zero DAI mint or burn events appeared via Whale Alert in this window 21. The marginal 24-hour supply decline of ~$2.8M visible in DeFiLlama is consistent with routine vault repayments rather than a discrete issuer action.

Whale and protocol movements

Spark Protocol: 400M USDT flows back in

At 13:54–13:56 UTC on May 20, two USDT tranches arrived at Spark Protocol (address 0xe2e7a1...):
  • 200,000,089 USDT (~$199.8M) from HTX — Whale Alert's tweet labeled the destination as "unknown wallet," but the transaction detail page shows Spark as the actual recipient 4
  • 200,000,000 USDT (~$199.9M) from an unlabeled wallet 5
The two tranches arrived two minutes apart, totaling 400M USDT. Context: the prior window logged ~890M USDT exiting Spark (500M to an unknown wallet + 390M to HTX). The 400M return partially reverses that — but leaves an estimated net 490M USDT still out of Spark relative to the May 19 balance. The 500M that went to the unknown wallet on May 20 at 01:27 UTC has not been observed moving to any exchange within this window. Whether those funds are dormant, held OTC, or staged for a later exchange deposit remains open.

Aave: 128M USDC round-trip (second consecutive day)

From 23:53 UTC on May 20 to 00:25 UTC on May 21, 128,354,994 USDC (~$128.4M) transferred from Aave to an unlabeled wallet (0x56957e...), then 128,383,520 USDC (~$128.4M) returned to Aave 32 minutes later 22 23. The net difference was +28,526 USDC — consistent with interest accrual or a yield arbitrage extraction. This is the second consecutive day a round-trip of this approximate size has cycled through Aave (a similar cycle involving a different address occurred the prior day). Net supply impact is zero.

262.8M USDC routed toward redemption and exchange channels

At 20:39 UTC on May 20, 124,000,000 USDC (~$124.0M) transferred from an unlabeled wallet to Paxos (0x264bd8...) — Paxos is a licensed USDC issuer and the destination is consistent with a redemption request, though on-chain burn confirmation was not available 24. At 21:42 UTC, 138,799,772 USDC (~$138.8M) transferred from a separate unlabeled wallet to Coinbase 25.
The two flows total $262.8M toward probable redemption or sell-side channels on the same day Circle minted $500M on Solana. The net issuance math: +$500M minted (Solana, two tranches) vs. −$124M probable redemption (Paxos) and −$138.8M exchange deposit (Coinbase). The actual USDC supply change for the 24-hour window was only −$23M, implying redemptions and other outflows absorbed the majority of new issuance — consistent with the flat 7-day trend.

Macro context

BTC and ETH

BTC closed the window at $77,456 (+0.95% in 24h), holding the same price level as the prior-window checkpoint — 24 hours of flat price action 26. CoinDesk cited CryptoQuant data showing the Bull Score Index at 20 (deeply bearish), matching levels from the March period when BTC traded between $60,000–$66,000 27. CoinDesk also noted that BTC turned lower after briefly testing the 200-day moving average at $82,400 — a rejection from the same level that preceded further declines in the 2022 cycle 27. Coinbase BTC premium turned negative, and Korean kimchi premium fell below zero — both indicating demand softness in two traditionally active buyer markets 27.
ETH stood at $2,112.61 (+0.71% in 24h), down roughly 8% from its recent high near $2,300 28.

Funding rate regime change

BTC perpetual contracts recorded 67 consecutive days of negative funding rates — the longest such streak in ten years, per K33 Research — before flipping to positive or near-zero around May 18 3. Across 67 days and 201 eight-hour settlement periods, short-side traders who held positions throughout paid continuous funding. AInvest reported the OI-weighted funding rate had turned positive to +0.012% — the highest since July 27 of last year — while Bitget's OI-weighted rate registered +0.0063% 29. Phemex separately noted a brief dip back to negative during the May 19 liquidation peak 30, suggesting the transition is not yet clean. The two data points are not contradictory — rates can swing positive intraday and dip back during high-volatility events; the directional shift from a structurally persistent negative regime to fluctuating-positive is the signal, not the exact level.
K33 Research's historical analysis of six comparable negative-funding-rate cycles since 2018 shows all six produced positive returns at the 90-day mark 3.

Liquidation structure flips

On May 20, total crypto liquidations fell sharply to $178.82M — down 73% from May 19's $657M — with short-side liquidations accounting for 57.5% ($102.76M) vs. long-side 42.5% ($76.05M) 31. This is the first session since May 12 in which shorts were the dominant liquidated side. The prior day's 89% long-sided cleanse ($584M in longs) came on the back of Trump's Iran warning and an oil spike to Brent $112; oil subsequently dropped to $106.18 (−4.58%) as the threat of military strikes was walked back 31.
The Crypto Times characterized the structure flip as suggesting the forced-selling phase has ended — while stopping short of calling it a trend reversal 31. BTC liquidations were $35.93M; ETH $30.78M — the two converged to near-parity after ETH had dominated liquidations in prior sessions.

ETF outflows and sentiment

US spot Bitcoin ETFs posted ~$2B in net outflows across seven trading days through May 19 — ending a six-week inflow streak that had accumulated $3.4B 32. The largest single-day outflow was $648.6M on May 18, with BlackRock's IBIT accounting for $448.3M of that 32. Total BTC ETF net assets fell to $100.29B — just above the psychological $100B threshold 32.
Dominick John of Zeus Research framed the activity as tactical rather than structural:
"Bitcoin ETF outflows reflect a short-term institutional risk-off move, driven by profit-taking and macro uncertainty. Institutions remain active but more tactical, using ETFs as liquidity tools to manage exposure. Flows now hinge on rates and volatility, with capital staying on the sidelines." 32

Fear & Greed: divergence widens

Alternative.me's Crypto Fear & Greed Index fell to 25 (Extreme Fear), down from 28 (Fear) the prior day and from 49 (Neutral) one week ago 33. CoinMarketCap's index read 39 (Fear), flat from the prior day and 14 points above alternative.me's reading 31. The gap reflects methodology: alternative.me weights retail sentiment proxies (social media, volatility, market momentum), while CMC incorporates derivatives data including put/call ratios and volatility indices that reflect more balanced institutional hedging.
正在加载图表…

Liquidity signal interpretation

Three data points from this window, read together, form a consistent picture:
1. Supply flatline is not the same as liquidity tightening. USDT, USDC, and DAI each moved less than 0.1% in 24 hours. But the within-day flows — 500M USDC minted on Solana, 262.8M moving toward redemption and exchanges, 400M cycling through Spark, 128M round-tripping through Aave — show active institutional recycling, not stagnation. The flat net supply is the output of large gross flows canceling each other. A genuine liquidity contraction would show net supply falling across multiple assets simultaneously with low gross flows; that pattern is not present here.
2. The funding rate flip and liquidation structure reversal point to the same thing: short positioning is now the crowded trade. When funding turns positive, long-side traders pay short-side traders — a regime associated with cautious or bearish positioning. When shorts simultaneously become the majority of liquidations (57.5% on May 20), it means the new inflow of shorts is getting squeezed on rallies. These two signals do not confirm a bottom; they confirm that the forced-liquidation of longs that dominated May 12–19 has run its course. What follows is open: short squeeze that accelerates upward, or renewed long entry once longs rebuild, or continued range-bound chop. The funding data alone cannot distinguish between them.
3. The 500M Spark USDT wallet remains the live open question. The unknown wallet that received 500M USDT from Spark on May 20 at 01:27 UTC has not moved those funds to any exchange visible in this window. If those funds surface at a CEX in the next 24–48 hours, the full 890M Spark flow reads as coordinated sell-side staging — a meaningful directional signal given BTC is holding the same price level. If the wallet stays dormant, the more likely interpretation is protocol treasury management or OTC pre-settlement with an institutional counterparty, which carries no direct sell-side pressure. This is the variable most worth tracking in the next session.
The macro backdrop — oil retreating, Iran risk decompressed, 30-year Treasury yield still near 5.1% 31 — sets the boundary conditions. Rate structure keeps the cost of capital high and limits the case for aggressive long deployment. Stablecoin supply staying flat in that environment means capital is neither fleeing nor rotating in at scale: it is waiting.

Cover image: AI-generated visualization.

围绕这条内容继续补充观点或上下文。

  • 登录后可发表评论。