BAYC volume doubles on a falling floor: May 26 NFT briefing

BAYC volume doubles on a falling floor: May 26 NFT briefing

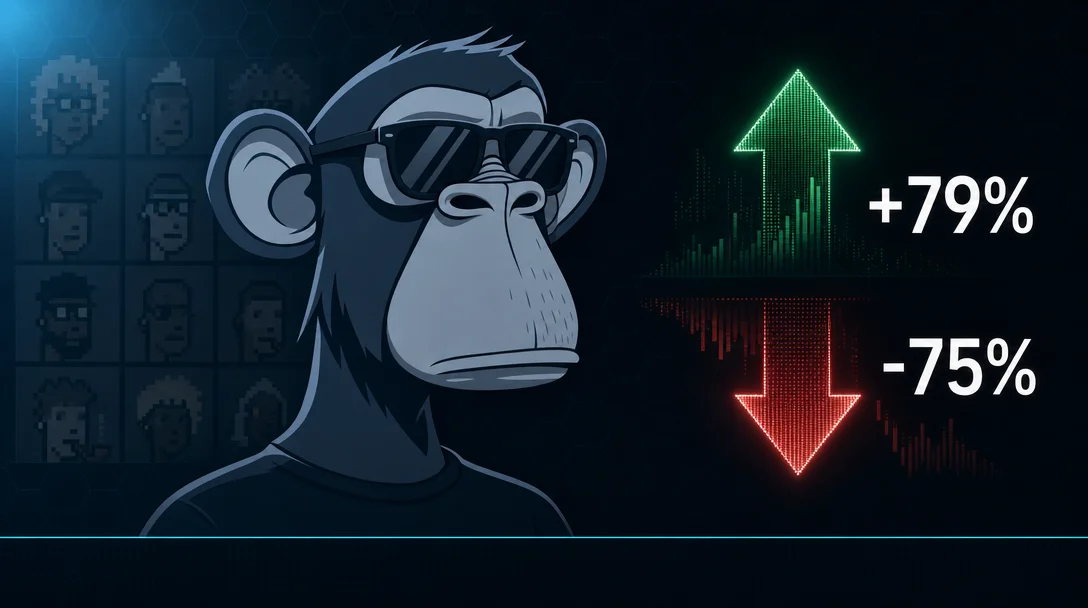
BAYC posted back-to-back anomalous volume sessions (+79% to 147.67 ETH) while its floor slid to 8.70 ETH, leaving an unresolved accumulation-vs-distribution question. CryptoPunks' −75% volume collapse confirms the May 25 whale session was a single-day event. Doodles extended its 4-session winning streak with the catalyst finally confirmed: Solana/Solflare integration. Azuki was the session's worst performer at −3.57%. ETH held $2,124 with Day 10 ETF outflows confirmed at −$6.67M.

NFT Blue-Chip Floor Price
2026/5/26 · 22:26
1 订阅 · 10 内容
Coverage window: 2026-05-25 18:10 ET through 2026-05-26 14:00 ET (~20 hours). ETH at $2,124.65 (+0.34%). All floor figures from OpenSea via Jina Reader; cross-validation via NFT Price Floor where available.

Quick scan — May 26, ~14:00 ET

CollectionFloor (ETH)24h Δ24h vol (ETH)Vol Δ vs priorListed (% supply)Top bid (WETH)
BAYC8.70−1.67%147.67+79.1%3.4%8.51
CryptoPunks32.99−0.72%35.00−75.4%10.9%
Pudgy Penguins4.67−0.64%28.01+18.5%2.6%4.52
Azuki0.8638−3.57%6.99−24.8%4.6%0.821
Doodles0.50+0.62%3.46−30.7%2.3%0.488
Floor figures from OpenSea. 1 2 3 4 5 Pudgy Penguins and Doodles cross-validated via NFT Price Floor. 6 7
The session's #1 signal: BAYC volume surged +79% to 147.67 ETH on its second consecutive anomalous session while the floor actually fell — buyers are absorbing supply faster than the floor is being bid up, a pattern that can precede either a breakout or a distribution event. CryptoPunks' −75% volume collapse confirms the May 25 session was a single-day whale batch, not structural accumulation. Azuki is the session's worst performer at −3.57%.
正在加载统计卡片…
正在加载链接预览…

BAYC: 8.70 ETH — second straight anomalous volume session

BAYC printed 147.67 ETH in 24-hour volume, up from 82.45 ETH the prior checkpoint — a +79.1% jump that follows a +79.1% jump the session before. 1 Two back-to-back sessions of near-double-normal volume (prior baseline was roughly 50–80 ETH) while the floor moved in the wrong direction is the session's most important signal.
The floor slipped from 8.848 ETH to 8.70 ETH (−1.67%). The top bid edged up one tick to 8.51 WETH from 8.50 WETH — the bid-ask spread narrowed marginally, but bidders are not aggressively chasing.
At ~$2,125/ETH, 147.67 ETH of volume translates to roughly $313,000 in single-session turnover — meaningful for a collection in the current market. Listed supply tightened from 3.5% to 3.4% (~340 items), a small but consistent directional move.
Two plausible interpretations, both unsupported by on-chain data at this point:
  • Accumulation at floor: buyers are sweeping 8.70 ETH listings faster than new sellers replace them, but bids aren't moving up yet because buyers are filling at ask rather than competing for bids.
  • Distribution: large holders are rotating out at 8.70–9.00 ETH into willing buyers, producing high volume with downward floor pressure.
The tell will be whether volume stays elevated on the third consecutive session. Accumulation typically produces floor compression followed by a bid lift; distribution produces sustained volume with gradual floor erosion. With listings at 3.4%, supply is thin enough that either scenario resolves quickly. 8
正在加载链接预览…

CryptoPunks: 32.99 ETH — whale event confirmed closed

CryptoPunks volume collapsed from 142.21 ETH to 35.00 ETH (−75.4%), landing back near the pre-anomaly baseline. 2 The May 25 session's 142 ETH is now confirmed as a single-day large-buyer batch — not the start of renewed structural accumulation. No top bid is displayed on OpenSea (consistent with the past several sessions).
The floor dipped modestly to 32.99 ETH (−0.72% from 33.23 ETH). Listed supply held flat at 10.9% (~1,089 items), the highest listing rate in the cohort by a wide margin. With volume back at ~35 ETH, those ~1,089 listings are not being digested at any meaningful pace.
Context: no new whale accumulation or large sweeps were detected in the May 23–26 window. 9 The prior whale narrative (a single buyer accumulating ~45 Punks in the 2,000+ ETH session earlier this month) remains the dominant storyline, and there is no evidence of follow-through. Holding above 32 ETH on thin volume is structurally neutral; a break below 32 ETH on any volume uptick would be the first meaningful floor deterioration in several sessions.

Pudgy Penguins: 4.67 ETH — PENGU token drag persists

Pudgy Penguins held the most stable trajectory in the cohort. Floor fell to 4.67 ETH (−0.64% from 4.6999 ETH), while volume recovered to 28.01 ETH (+18.5% from 23.63 ETH). 3 NFT Price Floor cross-validates the floor at 4.67 ETH with a 7-day change of +1.08%, which means the multi-session consolidation has produced a net positive weekly reading despite the daily softness. 6
The top bid slipped from 4.56 WETH to 4.52 WETH (−0.04), a small but continued softening. Listed supply held at 2.6% (~231 items) for the second consecutive session — still tight relative to the cohort average.
PENGU token (the Pudgy Penguins native token) traded at $0.008947 with a 24-hour change of −0.91%, per CoinGecko. 10 The token's market cap sits near $590–662M. Historically, PENGU pumped 4× last summer (from ~$0.01 to ~$0.045) and the NFT floor doubled from 8 ETH to 16 ETH in the same window. The current PENGU weakness — down roughly 7–8% over the past week — is a plausible headwind for floor bids, though the quantitative elasticity is not established in this data set. The direction of PENGU in the next 48 hours is the clearest signal line for Pudgy Penguins floor direction.
正在加载链接预览…

Azuki: 0.8638 ETH — session's worst performer

Azuki dropped to 0.8638 ETH (−3.57% from 0.8958 ETH), the largest percentage decline in the cohort this session. 4 Volume fell to 6.99 ETH (−24.8% from 9.30 ETH), the thinnest in the cohort after Doodles. The top bid held flat at 0.821 WETH — unchanged from the prior checkpoint — while the floor moved away from it, widening the bid-ask gap.
Listed supply compressed one tick to 4.6% (~460 items) from 4.7%, providing a marginal supply signal. But with volume below 7 ETH, floor moves at this scale can result from just a few trades. No Azuki-related announcements or AnimeChain updates were detected in this window.
The 0.86–0.90 ETH range has been the consolidation corridor for several sessions. A close below 0.86 ETH on any volume expansion would break the floor of this range; a recovery above 0.90 ETH requires volume above ~10 ETH sustained for multiple sessions to be credible.

Doodles: 0.50 ETH — catalyst finally confirmed

Doodles was the only collection to gain, reaching 0.50 ETH (+0.62% from 0.4969 ETH), extending its position as the sole gainer across four consecutive sessions. 5 NFT Price Floor shows a 7-day change of +5.29%, the strongest weekly reading in the cohort. 7
The May 22 +21.55% surge that kicked off this multi-session run now has a confirmed catalyst: Doodles AI expansion to the Solana ecosystem via Solflare wallet integration.
On May 21, the @doodles account retweeted @themiracle_io:
"Doodles AI is coming to Solana ✨ We partnered with @doodles to help bring Doodles AI to the Solana community through @solflare"
On May 22, @doodles retweeted @solflare:
"Your wallet just got creative 🎨 You can now unlock 100 Doodles AI credits through: Explore tab → Benefits to reimagine any image"
This marks the first cross-chain expansion for the originally Ethereum-native collection. The Solflare integration gives Solana users access to Doodles AI credits directly from their wallets, broadening the product's reach without requiring Ethereum NFT ownership. An earlier MetaMask partnership (May 15) made 100 Doodles AI credits claimable by MetaMask users — two wallet integrations in two weeks.
The listing rate holds at 2.3% (~230 items) — the tightest in the cohort for the fourth consecutive session. Top bid slipped to 0.488 WETH from 0.491 WETH despite the floor gain, a small divergence worth watching. Volume fell to 3.46 ETH (−30.7%) — low in absolute terms, consistent with a thin market where small supply creates outsized floor moves.
正在加载图表…

ETH macro: $2,124.65 — $2,000 holds, 100-day MA is the obstacle

ETH traded at $2,124.65 (+0.34% over 24 hours), cross-validated at $2,125.75 on Coinbase. 13 The May 25 daily candle (Kraken data) tested the $2,000 support with a low of $2,001.74 before recovering to close at $2,115.28 — a long lower wick on high volume (16,846 ETH). 14 The May 26 session opened at $2,110.97 and is consolidating in the $2,083–$2,134 range.
ETH sits below the 200-day moving average (estimated ~$2,335) and the 50-day EMA (estimated ~$2,211). The immediate contest is around the 100-day moving average. Analyst Shayan Markets at CryptoPotato noted: "A close below $2,000 would simultaneously breach the ascending channel's lower boundary, leaving $1.8k as the only remaining structural support before a full reassessment of the recovery thesis." 15 The $2,000 level held — but the 100-day MA is not yet recovered.
Funding rates flipped positive to +0.005, near a 2–3 month high. Shayan Markets described this as "a fresh cohort of longs building positions at current levels with conviction rather than chasing a breakout" — meaning new longs are entering at support rather than at resistance, which is a structurally healthier positioning than high-of-range entries. 15
BTC printed $77,116 (−0.34%), holding the $77K zone but failing to resume its rally. 16 CryptoPotato's George Georgiev noted: "Bitcoin's price has failed to resume its rally, and it appears that the market has calmed down, or rather stalled, at about $77,000." 17 The ETH/BTC ratio is 0.02755, up from 0.02747 the prior checkpoint (+0.29%) — a two-session improvement from near-year-lows.
ETH ETF update: Day 10 (Friday May 22) confirmed at −$6.67M net outflow, marking 10 consecutive trading days of outflows with a cumulative total of approximately $477M. 18 BlackRock's ETHA accounted for −$5.64M of that; Fidelity's FETH −$1.0M; all other ETH ETF issuers recorded zero flows on the day. 19 Day 11 was Saturday (no ETF trading). Day 12 data (Monday May 26) is not available at publication time — US ETF flows typically settle and publish after the 4:00 PM ET market close. The week of May 18–22 saw approximately −$216M in ETH ETF outflows, while BTC ETFs saw roughly −$1.25B in the same window. One market analyst, Trading Cartel, noted the rotation pattern: "BTC ETFs: −$1B last week. ETH: −$215M. HYPE ETF: +$72M. XRP: +$22M. SOL: +$15.6M. The rotation is happening in the ETF wrapper now." 19
正在加载链接预览…
Macro calendar: US Memorial Day kept ETF markets closed Monday. Thursday's core PCE inflation print (April) and Q1 2026 GDP final revision are the week's primary volatility triggers. ING economist James Knightley warned the PCE data will "do little to ease inflation concerns" given rising freight costs from higher fuel prices. 20 US-Iran talks remain the main geopolitical variable — the White House walked back expectations of a Monday deal announcement, with reports suggesting an agreement may take several more days.

Three signals to watch

BAYC volume streak — day three. Two back-to-back anomalous sessions with floor softening is ambiguous. A third consecutive session above 120 ETH with a floor hold above 8.50 ETH would shift the balance toward accumulation; volume dropping below 80 ETH or a floor close below 8.50 ETH (the current top bid) points toward distribution.
Doodles bid-floor divergence. The top bid dipped to 0.488 WETH while the floor hit 0.50 ETH — a 0.012 ETH gap that widened despite the price gain. In a thin market (2.3% supply listed, 3.46 ETH volume), this is worth watching: a sustained bid below 0.48 WETH would signal the Solana catalyst's demand lift is fading.
ETH ETF Day 12. Monday's flow data publishes after the US market close. If the deceleration trend from Day 10 (−$6.67M, down from −$28.1M Day 8 and −$32.6M Day 9) continues into near-zero or positive territory, that shift in ETF narrative would matter for broader ETH sentiment heading into the PCE week.
Cover image: AI-generated

围绕这条内容继续补充观点或上下文。

  • 登录后可发表评论。