
Daily Top US Stock Picks — June 9, 2026: AMD & AMZN
Nasdaq's worst week of 2026 (-4.2% Friday) set up two dip-buy opportunities for Monday's open: AMD (-11% on June 5 to ~$466) on a fundamental ramp that remains intact — $10.25B Q1 revenue, 57% data center growth, Meta 6GW GPU deal, $11.2B Q2 guide; and Amazon (~$254) trading at a 3-year valuation low as AWS hit 28% growth in Q1 (fastest in 15 quarters), EPS beat by 70%, and consensus targets average $312 (+23% upside).

Issue #6 | Global Tech & Growth Research | Weekend Preview for Monday Open
Macro & market sentiment
Friday's chip massacre left the tape in a fragile state heading into Monday. The S&P 500 shed 2.64% to close at 7,383.74 on June 6, capping the index's worst weekly performance of 2026 at -2.6%. The Nasdaq Composite fell 4.2% on Friday alone — its sharpest one-day drop in more than a year — as semiconductor names led the selling. 1
The trigger was the May jobs report: +172,000 payrolls, more than double the 80K consensus, printed at 08:30 EDT on Friday. The 10-year Treasury yield pierced 4.54% on the news, and the 2-year climbed to 4.16% — a one-year high. Fed-funds futures pricing shifted sharply, with traders now assigning roughly 70% probability to at least one additional rate hike by year-end, up from less than 50% before the print. 1
Broadcom's underwhelming Q3 revenue guidance — released Wednesday evening — poured accelerant on the fire. The market had priced in an acceleration that AVGO's numbers didn't quite deliver, reintroducing valuation doubt into a sector trading at peak multiples. AMD, Micron, Marvell, Intel, Qualcomm, and ARM Holdings all closed down 10% or more on Friday. 2
What Monday opens into: Rate anxiety is real, but the underlying AI capex cycle remains intact. Two names warrant a close look for the next session.
正在加载内容卡片…
Recommended picks
Pick 1: Advanced Micro Devices (AMD) — Tactical dip with structural conviction
Rating: Buy on weakness | Last close (Jun 5): ~$466 | 52-week range: $114.72 – $546.15
Investment thesis
AMD fell nearly 11% on Friday into a macro- and sentiment-driven selloff, not a fundamental one. The company's Q1 2026 earnings — reported in late April — were unambiguously strong, and the forward setup remains compelling. The Friday close put AMD at a ~14% discount from its May pivot-top near $523, with volume-support levels at $455 suggesting the flush is nearing technical exhaustion. 3
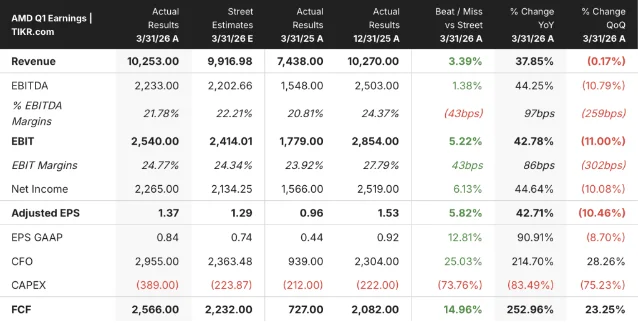
The fundamental story: AMD's Q1 2026 revenue came in at $10.25B (+38% YoY), beating the $9.92B consensus by roughly 3%. 4 Data Center revenue of $5.8B grew 57% YoY — AMD's fastest segment growth in several quarters — driven by server CPU share gains and a steep ramp in Instinct AI GPU volumes. Critically, AMD has now surpassed Intel in quarterly data center revenue for the first time.
The TAM call that changed the narrative: On the Q1 earnings call, CEO Lisa Su raised AMD's 2030 server CPU TAM forecast from ~$60B to over $120B — reflecting agentic AI workloads requiring far more CPU capacity per GPU than previously modeled. If Citi's own 2030 server CPU forecast of ~$132B is directionally correct, AMD's 34%-to-50%+ share capture trajectory looks credible. 4
Two customer wins lock in the demand visibility: Meta confirmed deployment of 6 gigawatts of Instinct GPUs, including custom MI450-architecture chips co-designed for next-generation AI workloads; and the OpenAI partnership announced earlier extends multi-year, multi-gigawatt GPU delivery across the two largest AI infrastructure spenders globally. Management said MI450 and the Helios rack platform orders have "exceeded initial plans."
Q2 guidance of ~$11.2B (+46% YoY) with 56% gross margin guidance (up from 55% in Q1) confirms the ramp is holding.
Fundamental highlights
| Metric | Q1 2026 | YoY change |
|---|---|---|
| Total revenue | $10.25B | +38% |
| Data Center revenue | $5.8B | +57% |
| Client + Gaming | $3.6B | +23% |
| Gross margin | 55% | +4 pp |
| Free cash flow | $2.57B | >2× |
| Q2 revenue guidance | ~$11.2B | +46% est. |
Technical read
After the -10.86% Friday drop, AMD sits just above its primary volume-support band at $455–$467. The long-term moving average (the 200-day equivalent at ~$414) provides a deeper floor. Short-term MA resistance sits at ~$514, and a re-close above that level would confirm trend recovery. 3
RSI on the daily chart has moved from overbought territory following the June 3 pivot-top sell signal. This is a pattern the stock has displayed three times in the current bull leg — short-duration overshoot, flush on macro news, recovery within 2–3 weeks. MACD remains on a 3-month sell signal, which argues for scaling in rather than buying the full position in a single tranche.
- Fibonacci S1: $462.75 | Volume support: $455.19
- Resistance R1: $494.57 | Resistance R2: $504.40 | Resistance R3: $520.31
- Projected Monday open range: $451–$481 (based on 14-day ATR of ~$29)
- Stop-loss level: $443.90 (–4.8% from last close)
Street view
36 Buy / 5 Outperform / 10 Hold ratings. Consensus target $472 (slight discount to last close given the May run-up above targets). High target $625 (Evercore ISI). 4 Next earnings: August 4, 2026.
Risk factors
- Rate sensitivity: AMD trades at a ~68–75× forward P/E — high-multiple growth stocks bear disproportionate pain in a rate-hike repricing. If the 10Y pushes toward 4.7–4.8%, multiples compress further before fundamentals can stabilize the stock. 5
- MI450/Helios ramp execution: Both products are in early production ramp through Q3, with full-scale ramp targeted in Q4. Early production yields below corporate average are a known short-term gross margin headwind.
- Competitive reaction: NVIDIA's Blackwell production ramp and customer loyalty makes winning AI GPU hyperscaler accounts difficult — AMD's wins are concentrated in the alternative/diversification allocations that Meta and OpenAI want.
- Gaming/consumer softness: Memory price volatility could weaken consumer PC demand in H2 2026, pressuring the Client segment.
1–3 month strategy
- Entry zone: $455–$475 on continued weakness or Monday gap-down below $460. YTD gain of ~118% means large positions will encounter profit-taking; sizing accordingly.
- Catalyst watch: (1) Helios rack shipment confirmation from hyperscaler quarterly calls in late July; (2) AMD Advancing AI event on July 23 — Lisa Su typically uses this event to expand the product/TAM narrative; (3) August 4 earnings for Q2 actuals vs. $11.2B guidance.
- Stop/reassess: Close below $414 (long-term MA support) with volume would break the structure of the current bull leg — reassess or exit.
- Target range: $520–$560 on a 2–3 month horizon, contingent on no significant deterioration in Helios ramp cadence.
Pick 2: Amazon.com (AMZN) — AWS re-acceleration at a 3-year valuation discount
Rating: Buy | Last close (Jun 5–6): ~$250–254 | 52-week high: ~$272
Investment thesis
Amazon is the least rate-sensitive of the mega-cap AI infrastructure names, and the market's fixation on near-term capex concerns has compressed the stock to what several analysts describe as a 3-year P/E low. The core error in the bear case is conflating AMZN's 2026 capex acceleration with cost drag — the same capex drove AWS from a low-20s growth rate to 28% YoY in Q1 2026, the fastest quarterly pace in 15+ quarters.
Amazon's Q1 2026 earnings, reported in late April, showed: 6
- Total revenue: $181.5B (+17% YoY), beating the $177.3B LSEG consensus
- EPS: $2.78, beating the $1.64 consensus by 69.5% — the largest relative EPS beat among FAANG names this earnings cycle
- AWS revenue: $37.6B (+28% YoY), vs. Street estimate of $36.6B — fastest growth since 2023
- Operating income margin: 13.1% — an all-time record for the consolidated company
- Advertising: $17.24B (+20%+ YoY) — structurally taking share from linear TV and social
The $7.6% weekly decline ended June 6 is the market pricing in: capex concerns from Amazon's own disclosure of heavy data center infrastructure investment scheduled through 2027; and macro rate risk. Both are already visible in the stock's valuation. 7
Q2 2026 guidance: $194–199B revenue (+16–19% YoY), with operating income of $20–24B, well above the comparable Q2 2025 figure of $19.2B. Barclays analyst Ross Sandler has Q3 AWS growth at 34% — reinforcing a multi-quarter reacceleration trajectory. 6
Fundamental highlights
| Metric | Q1 2026 | Detail |
|---|---|---|
| Total revenue | $181.5B | +17% YoY; beat $177.3B est. |
| AWS revenue | $37.6B | +28% YoY; fastest in 15 qtrs |
| EPS | $2.78 | Beat $1.64 est. by 70% |
| Operating margin | 13.1% | All-time record |
| Advertising revenue | $17.24B | +20%+ YoY |
| Q2 revenue guidance | $194–199B | +16–19% YoY |
| Q2 operating income guidance | $20–24B | vs. $19.2B in Q2 2025 |
Technical read
AMZN is trading near the lower end of its 2026 range at ~$250–254, approximately 17–20% below the 66-analyst consensus target of $312.63. Morningstar's executive quote cites a fair value of ~$261.60, suggesting the stock is at or near fundamental floor. 8
The stock is in its third week of consolidation after the post-earnings run toward $270–272. On a relative basis, AMZN is holding up substantially better than AMD and NVDA in the chip rout — the business is less exposed to semiconductor-specific sentiment. Rate sensitivity exists (AWS capex intensity makes the bond proxy argument) but is more muted than pure-play semis.
正在加载内容卡片…
- Near-term support: $244–248 (prior base breakout range)
- Resistance: $265–270 (May high cluster)
- Analyst consensus target: $312.63 (+23% from ~$254)
- High target: $370 (Morgan Stanley's Evercore comp)
Street view
Strong Buy consensus across 60+ analysts. Target range: $207 (bear) to $370 (bull). Evercore ISI's Mark Mahaney has AMZN as his top large-cap long for 2026, with 27% AWS growth modeled for full-year 2026. UBS target $311; Barclays Overweight at $300; Morgan Stanley $325. 6
Next earnings catalyst: Amazon Prime Day typically serves as an H2 revenue inflection signal; next formal Q2 earnings call expected late July. Mark your calendar for June 23 — Amazon is expected to hold an AWS Summit and/or investor update. 9
Risk factors
- Capex overhang: Amazon has flagged significant data center capex through 2027. If AWS growth stalls below 25% in Q2 or Q3, the market will price the capex as cost rather than investment.
- Rate sensitivity: At ~3× EV/sales, AMZN is expensive on traditional metrics; higher-for-longer rates compress multiples even when earnings hold.
- Regulatory: FTC antitrust activity, EU digital markets rules, and potential restrictions on AWS government-contract concentration remain ambient risks.
- Retail margin fatigue: North America retail margins have improved but remain thin; any logistics cost spike or consumer demand softness would compress consolidated margins.
1–3 month strategy
- Entry: Current range $248–260 is attractive versus the $312 consensus target; position sizing should account for macro-driven volatility around Fed communication (FOMC is not until July 29–30).
- Add-on trigger: A daily close above $265 with above-average volume would confirm a re-test of May highs as the near-term base holds.
- Catalyst watch: (1) June 23 AWS-related investor event; (2) Any Fed commentary walking back the 70% hike probability (rate reversal would disproportionately benefit AMZN vs. pure semis); (3) Q2 earnings in late July — specifically AWS revenue vs. the $40B Street estimate.
- Stop/reassess: A weekly close below $244 would put the stock back inside the prior 4-month range and warrant position reduction.
- Target range: $285–310 on a 2–3 month horizon, with $325–370 as a bull-case if AWS prints 30%+ in Q2.
Watchlist notes
- PLTR (~$160): YTD -9.3% with +11.4% last week on drone/Dell partnership news; stretched at ~$369B market cap requiring unprecedented federal market share to justify. Pass for now.
- CRM: Q1 FY27 non-GAAP EPS $3.88 beat expectations; FY27 guided revenue $45.9–46.2B; Bridgewater recently sold shares. Potential next rotation if macro settles.
- PANW: Beat Q3 FY2026 estimates; shares popped ~5.7% on earnings. Cybersecurity sub-sector lagging the broader AI trade — revisit when risk appetite returns.
This report reflects research completed as of Sunday, June 8, 2026 (market open Monday, June 9). All price references are as of the June 5–6 close unless otherwise noted. This is not investment advice. Past performance does not guarantee future results.
参考来源
- 1WSJ: Nasdaq Suffers Worst Week in More Than a Year
- 2Kavout: What Triggered the Recent Semiconductor Sell-Off
- 3StockInvest.us: AMD Signals & Forecast
- 4TIKR: AMD Stock Forecast 2026
- 5Trefis: Structural Risks for AMD
- 6Investing.com: Amazon's AI Cloud Strategy
- 7Yahoo Finance AMZN quote
- 8MarketBeat: AMZN forecast
- 9Barchart: Amazon June 23 event
围绕这条内容继续补充观点或上下文。