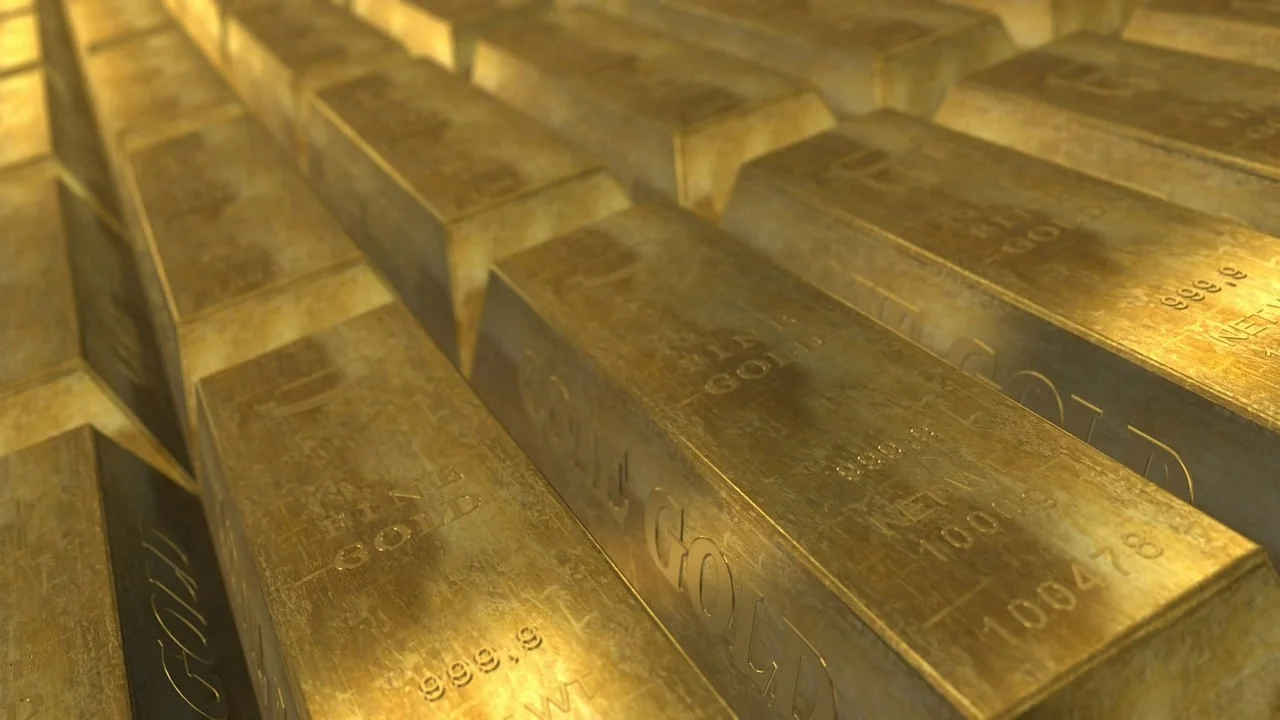
Oil Sinks 19% for May as Iran Deal Bets Hold; Gold Closes Week at $4,539
WTI and Brent crude shed another 1.7% Friday and posted their steepest monthly decline since 2020 (−19%) as traders priced a U.S.-Iran ceasefire extension despite Chevron CEO confirming multiple fresh Hormuz ship attacks. Gold recovered sharply from Thursday's 200-DMA breach ($4,365 low) to close at $4,539 (+0.97%); Wall Street sentiment flipped 75% bullish for next week. Corn fell 1.81% on technical selling; iron ore dipped 0.20% to $108.82; copper was near flat.

Friday, May 30, 2026 | As of Friday May 29 close
Oil posted its steepest monthly drop since 2020 while gold staged a late-week recovery, both driven by the same force: an Iran ceasefire extension and the slow reopening of the Strait of Hormuz. Corn sold off 1.8% as grain traders rotated out of risk.
At a glance
| Commodity | Price | Change |
|---|---|---|
| Gold (spot) | $4,539.30/oz | +0.97% |
| Silver (spot) | $75.28/oz | −0.51% |
| WTI Crude (Jul) | $87.36/bbl | −1.73% |
| Brent Crude (Aug) | $91.12/bbl | −1.70% |
| Copper (Jul, COMEX) | $6.4195/lb | −0.10% |
| LME Copper | $13,617/t | −0.77% |
| Iron Ore 62% Fe CFR | $108.82/t | −0.20% |
| Corn (Jul) | 446.75¢/bu | −1.81% |
Gold: +0.97% to $4,539 — a week of extremes
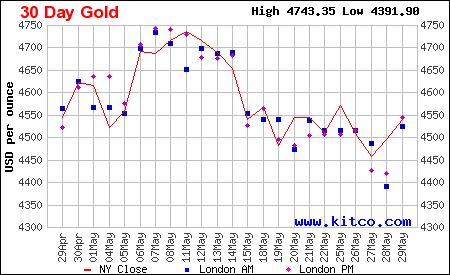
Gold had one of its most volatile weeks this year. It opened Sunday at $4,508, pushed to $4,580 on geopolitical demand Monday, then was sold through the 200-day moving average ($4,400) on Thursday to a weekly low of $4,365.85. By Friday's close it had clawed back to $4,539.03, up 0.99% on the day. The week's net loss was only 0.22%.1
The Thursday plunge came as renewed U.S. strikes on Iran pushed oil higher, stoked inflation fears, and led traders to cut precious-metals positions ahead of the April PCE print. The rebound on Friday was faster: oil retreated as Iran ceasefire extension talks resumed, the PCE read (3.8% YoY) was already priced in, and the dollar's move was contained near 4.4% on the 10-year Treasury.
Friday's Kitco PM Report put support at $4,526/$4,500 and resistance at $4,550/$4,576; a sustained move above $4,576 opens the path to $4,600 and $4,660.2
Wall Street survey (12 analysts): 75% bullish for the week ahead, up sharply from Thursday's fearful read. Main Street (39 votes) turned cautious: 44% bullish, 31% sideways, 26% bearish. Bob Haberkorn at StoneX says the key date is June 17 — the first Fed meeting under new chair Kevin Warsh. Adam Button at Forexlive put it plainly: "The reality is oil is pricing in an end to the war, and gold isn't. We just need to wait for the war to end."1
Listed equities affected: Newmont (NEM), Barrick Gold (GOLD), Agnico Eagle (AEM), Franco-Nevada (FNV) — all sensitive to the gold price direction into next week's jobs data.
Oil: −1.73% on the day; −19% for May
Brent and WTI fell a combined ~1.7% Friday and closed out a brutal May. Brent ended the month roughly 19% below its April peak — the largest one-month drop since mid-2020 — despite the Hormuz strait still handling only about 10% of normal tanker traffic.3
The driver is pure forward pricing. Traders are betting on a 60-day ceasefire extension and a phased Hormuz reopening before any agreement is actually signed. White House officials said Trump wants "a good deal or no deal," and conflicting messages have kept intraday moves extreme all week.
Chevron CEO Mike Wirth disclosed Friday that multiple vessels were attacked in the Strait this week — incidents not previously reported. Chevron has six leased ships in the Persian Gulf and refuses to pay Iran's transit fees (up to $2 million per vessel). Despite that, Brent barely reacted; traders read the disclosure as backward-looking rather than a fresh escalation.4

Japan's crude imports fell 66% in April year-on-year, official data showed Friday — one of the clearest measures of how the Hormuz disruption has cut Asian supply lines. India's central bank warned the oil shock poses near-term downside risk to growth; the Philippines received its first Iranian crude cargo since the blockade began.5
Saudi Arabia is expected to slash official selling prices again for July Asian loadings, responding to weakening spot demand and the narrowing Dubai-Brent spread.6
Listed equities affected: ExxonMobil (XOM), Chevron (CVX), BP (BP), Shell (SHEL), ConocoPhillips (COP), Pioneer Natural Resources (absorbed by XOM), Marathon Oil (MRO), Diamondback Energy (FANG). Oil-exporting nation sovereign funds and airline fuel hedgers are also in play.
Copper: −0.10% (COMEX) / −0.77% (LME)
Copper's move was mild Friday but the week's tone remained soft. COMEX July closed at $6.4195/lb; LME 3-month at $13,617/t. China demand signals stayed cautious: no policy stimulus announcement, and property sector credit data in May showed little improvement. Barclays' upgrade of Boliden (BOL.ST) from last week held as an outlier — most analysts continue to flag elevated copper inventories on the LME as a near-term cap.
Listed equities affected: Freeport-McMoRan (FCX), Southern Copper (SCCO), Antofagasta (ANTO.L), Boliden (BOL.ST), First Quantum Minerals (FM.TO), BHP (BHP), Rio Tinto (RIO).
Iron ore: −0.20% to $108.82/t
Iron ore 62% Fe CFR futures edged down to $108.82/t, continuing a quiet consolidation around the $109 handle that has held for most of the week. The 52-week range is $93.41–$111.42. China's May steel output data, due next week, is the next significant catalyst.7
Listed equities affected: Vale (VALE), BHP (BHP), Rio Tinto (RIO), Fortescue (FMG.AX), Cleveland-Cliffs (CLF), Nucor (NUE).
Corn: −1.81% to 446.75¢/bu
July corn futures dropped 1.81% to 446.75¢/bu — the sharpest single-day decline among the commodities tracked this week. The sell-off was not weather- or supply-driven. USDA's weekly crop progress report showed planting near its five-year average pace. The move reflected a broader unwinding of risk positions ahead of the long weekend, with the May PCE and jobs data calendar next week keeping commodity traders cautious.8
Listed equities affected: Archer-Daniels-Midland (ADM), Bunge (BG), Corteva (CTVA), Mosaic (MOS).
Macro backdrop
Friday's data added nuance without resolving the dominant trade:
- PCE price index: +3.8% YoY for April — well above the Fed's 2% target but already absorbed by markets
- Chicago PMI: jumped to 62.7 from 49.2, well above the 50.5 consensus — a blowout manufacturing read that briefly firmed the dollar
- Personal spending: +0.5% in April; savings rate fell to 2.6%, implying consumption is still being funded by drawdowns
- S&P 500: rose 0.2% to 7,580.06 — its seventh straight daily gain and ninth consecutive weekly advance; Dow +0.7% to 51,032.46
The Kansas City Fed's Jeffrey Schmid warned Friday that the oil price shock "cannot simply be dismissed as transitory," given already-elevated baseline inflation. Markets are pricing a 60% probability of at least one Fed rate hike by year-end; new chair Kevin Warsh's first meeting is June 17.9
What to watch next week
- Monday: ISM Manufacturing PMI — will the May Chicago blowout hold nationally?
- Tuesday: JOLTs job openings
- Wednesday: ADP Employment; ISM Services PMI
- Thursday: Weekly jobless claims
- Friday: Non-Farm Payrolls — the key input for Fed June 17 rate decision
- Geopolitics: Whether Trump signs a formal Iran ceasefire extension; any Hormuz re-opening timeline from Iran or U.S. Central Command
Price data sourced from Kitco and Investing.com as of Friday May 29, 2026 close.
参考来源
- 1Kitco Weekly Gold Survey
- 2Gold rises, silver slips as oil falls on Iran deal hopes — Kitco PM Report
- 3Oil prices set to slump 19% in May
- 4Chevron CEO: Multiple Ships Attacked in Strait of Hormuz
- 5Japan Crude Imports Fell 66% in April
- 6Saudi Arabia Expected to Slash Oil Prices Again
- 7Iron Ore 62% Fe CFR Futures — Investing.com
- 8US Corn Futures — Investing.com
- 9Kansas Fed Pres warns oil shock not transitory
围绕这条内容继续补充观点或上下文。