PGR (Progressive Corporation) — America's #1 auto insurer, ROE accelerating to 37%, P/E at a 5-year low near $190

PGR (Progressive Corporation) — America's #1 auto insurer, ROE accelerating to 37%, P/E at a 5-year low near $190

Progressive Corporation (NYSE: PGR) clears all three hard screening criteria: ROE of 19.25% / 33.14% / 37.29% for FY2023–FY2025 (SEC EDGAR XBRL verified); three consecutive years of positive and growing FCF ($10.4B / $14.8B / $17.2B); and a trailing P/E of 9.68x sitting 46% below its own 5-year median of 17.91x. The article covers Progressive's telematics-driven underwriting model, the full SEC-sourced ROE table, FCF trend, a 5-peer valuation comparison table (TRV/ALL/CB/HIG/CINF), balance sheet data (D/E 0.26x, interest coverage 50.9x, AM Best A+ / Fitch AA), risk factors (earnings normalization, BI severity, CFO transition, insider selling), the variable dividend structure, and a bull/bear framework anchored to Q2 2026 combined ratio and net premiums written growth.

US Stock Pick: 3-Year ROE > 15%
2026/5/31 · 21:34
1 订阅 · 13 内容
Current price: $190.40 (May 29, 2026 close, −$4.11 / −2.11%) · Market cap: ~$111.3B · Sector: Financials / Property & Casualty Insurance 1
Progressive Corporation (NYSE: PGR) is the largest private passenger auto insurer in the United States, with trailing twelve-month direct premiums now leading State Farm by more than $1.57 billion. 2 At $190.40, the stock trades within $1.20 of its 52-week low of $189.20 — down 34% from the $289.96 high set less than a year ago — while the business itself is generating record earnings, record cash flow, and accelerating market share. 1 That divergence between stock price and business performance is the central question this analysis works through.
Three hard screening criteria are met: return on equity has risen from 19% to 33% to 37% across FY2023–FY2025 (all three years verified against SEC EDGAR filings); free cash flow has been positive and growing every year, reaching $17.2B in FY2025; and a trailing P/E of 9.68x sits 46% below the stock's own 5-year median of 17.91x. 3 1

What Progressive does and how it makes money

Progressive (NYSE: PGR) writes automobile insurance — primarily personal auto, but also commercial auto (trucks, fleets) and a growing homeowners book sold through third parties. Its customers pay premiums; Progressive pays claims; the gap between the two, after operating expenses, is the underwriting profit that drives ROE. In insurance, a combined ratio (CR) below 100 means the company is profitable on its core underwriting activity before any returns from its investment portfolio. Progressive's FY2025 combined ratio was 87.4, meaning it spent $87.40 in losses and expenses for every $100 of premium collected. 4 The U.S. property and casualty industry's 2024 combined ratio was 97.0 — making Progressive's underwriting margin advantage roughly 10 percentage points above the broader market. 5
Progressive operates two distribution channels: direct (online and phone, no agent) and agent/agency (independent agents). The direct channel — where the Flo and Name Your Price advertising campaigns live — has grown to 16.2 million personal auto policies in force (PIF), or about 54% of the personal auto book. Commercial auto adds another ~700,000 PIF. The property book (sold through agents, covering homeowners bundled with auto policies) holds 3.7 million PIF. 2
The investment portfolio is a secondary earnings engine. Progressive, like all P&C insurers, holds the premiums collected against future claims as an investment float. With $87.6B in TTM revenues and an average float duration of roughly 18 months, the portfolio is large relative to equity — generating net investment income that supplements underwriting profit.

ROE track record — SEC EDGAR verified

All figures use net income divided by end-of-period stockholders' equity (consolidated basis, per SEC EDGAR XBRL CIK 0000080661). Progressive carries no significant noncontrolling interests, so consolidated and parent equity are effectively equivalent. 3
Fiscal yearNet incomeStockholders' equityROE
FY2023 (ended Dec 31, 2023)$3,902.4M$20,277.1M19.25%
FY2024 (ended Dec 31, 2024)$8,480.0M$25,591.0M33.14%
FY2025 (ended Dec 31, 2025)$11,308.0M$30,323.0M37.29%
TTM (to Mar 31, 2026)$11,559.0M~$30,500M~37.9%
Sources: 3 1
The trajectory is accelerating, not plateauing. The 19% ROE in FY2023 was earned despite the auto insurance industry still absorbing inflation-driven claim severity pressure. FY2024's jump to 33% came from net income more than doubling (+117%), driven by prior-year rate increases flowing fully through the combined ratio.
FY2025's 37% ROE reflects a further 33% profit increase on a now-higher equity base. The driver throughout has been underwriting discipline rather than financial leverage: Progressive grew its premium base from $62.1B (FY2023) to $87.7B (FY2025), earned the margin on it, and reinvested the surplus in policyholder growth.
FY2023 deserves brief context. That year's 6.28% net margin (net income / revenues) was modest by Progressive's own standards because Q1 2023 net income was only $447.9M — the tail end of the inflationary claims cycle that hit the entire industry in 2022–2023. The ROE of 19.25%, earned even in that environment, demonstrated the durability of Progressive's underwriting model through the cycle. 3

Free cash flow — the insurance float advantage

Insurance companies generate cash flows that look structurally different from manufacturers or software companies. Premiums are collected up front, claims are paid later — so operating cash flow tends to run well above reported net income. Progressive's FCF/net income ratio has been stable at 150–160% across FY2023–FY2025, a reliable structural feature rather than an accounting artifact.
正在加载图表…
FCF figures (operating cash flow minus capital expenditures), SEC EDGAR basis: 3
  • FY2023: $10,643.3M OCF − $252.0M CapEx = $10,391.3M (positive FCF despite cyclical headwinds)
  • FY2024: $15,119.0M OCF − $285.0M CapEx = $14,834.0M (+42.8% year-over-year)
  • FY2025: $17,548.0M OCF − $348.0M CapEx = $17,200.0M (+15.9% year-over-year)
  • TTM (to Mar 31, 2026): $16,420.0M (FY2025 FCF − Q1 2025 FCF of $5,084M + Q1 2026 FCF of $4,304M)
FCF yield at current price: $16,420M ÷ $111,263M market cap = 14.76%. This is a number that merits attention. For comparison, the 10-year Treasury yield stands around 4.3% — PGR's FCF yield is more than three times that. The Q1 2026 FCF of $4,304M was lower than Q1 2025's $5,084M, partly because $950M of Florida homeowners credits (related to HB 837 insurance reform and a below-normal 2025 hurricane season) were paid out in Q3 2025, shifting the seasonal pattern of cash flows. 6
CapEx has grown with the business ($252M → $348M over three years) but remains minimal relative to operating cash flow — approximately 2% of revenues. Progressive is not a capital-intensive business in the traditional sense: underwriting capacity scales with premium dollars collected, not physical plant investment.

Revenue, earnings, and margin expansion

正在加载图表…
YearRevenueNet incomeNet marginOperating margin
FY2023$62,108.5M$3,902.4M6.28%8.33%
FY2024$75,372.0M$8,480.0M11.25%14.58%
FY2025$87,671.0M$11,308.0M12.90%16.54%
Q1 2026$22,188.0M$2,818.0M12.70%~16.0%
Sources: 3
Revenue grew at a three-year CAGR of approximately 19% ($62.1B → $87.7B), driven by both rate increases and policy count expansion. Net income compounded at a faster pace — +190% cumulatively over the three years — as margins expanded from 6.28% to 12.90%. Operating margin nearly doubled over the same window (8.33% → 16.54%).
Q1 2026 showed growth deceleration: revenue of $22.2B was up 8.7% year-over-year (versus double-digit growth throughout 2023–2025), and net income of $2.8B grew 9.8%. The Q1 2026 earnings call beat revenue consensus by $360M but EPS of $4.80 came in $0.03 below the $4.83 estimate. 2 Net premiums written growth has slowed from 21% (FY2024 full year) to 17% (Q1 2025) → 12% (Q2 2025) → 10% (Q3 2025) → 8% (Q4 2025) → 4% (January 2026). 5 The deceleration reflects two things working simultaneously: the industry-wide rate cycle that turbocharged Progressive's premiums in 2023–2024 is normalizing, and competitor margins have improved enough for Allstate, State Farm, and GEICO to compete aggressively again. Progressive's CEO Tricia Griffith addressed this directly on the Q1 2026 call: "We don't know how long the soft market will prevail, but we have definitely seen a lot more competition because everyone has great margins." 2
The deceleration matters, but scale matters too. Progressive's personal auto policies in force grew by nearly one million in Q1 2026 alone (+11% year-over-year). In 2025, the company captured $8.9B of the U.S. personal auto industry's $11.8B total net premium growth — 76% of the entire industry's gain. 2

Valuation — 46% below the 5-year P/E median

正在加载统计卡片…
Sources: 1 7
The 5-year valuation context changes how the current P/E reads. The 5-year P/E median is 17.91x (22 quarterly data points from Q1 2021 through Q1 2026). 8 The 5-year P/E average is 30.27x — but that figure is severely distorted by 2022 Q4 (P/E 100x) and 2023 Q1 (P/E 93x), when catastrophic claims and rampant auto inflation briefly crushed earnings per share to near zero. The median of 17.91x is the more meaningful reference point; at 9.68x today, the stock trades at a 46% discount to its own median earnings multiple, while the underlying business is earning more per share than at any point in its history (TTM EPS: $19.66). 1 8
Why is the market applying a compressed multiple? The forward P/E of 12.02x implies the market's analyst consensus for next-year EPS is roughly $15.84 — a 19.4% decline from the TTM EPS of $19.66. 1 The market is explicitly pricing in earnings normalization: the exceptional combined ratios of FY2024–FY2025 (driven by favorable catastrophe weather and a hard market rate cycle) are not expected to repeat. The question for investors is whether the normalization assumption embedded in that forward estimate is reasonable, excessive, or insufficient.
Peer comparison table (data as of May 29, 2026):
CompanyTrailing P/EForward P/EP/BEV/EBITDAROEFCF yield
PGR (Progressive)9.68x12.02x3.47x7.89x37.9%14.76%
TRV (Travelers Companies — P&C insurer, independent agents)8.68x10.48x1.94x6.70x25.3%N/A
ALL (Allstate — personal auto/home)4.55x†7.80x1.80x4.03x45.2%21.74%
CB (Chubb — global P&C, specialty)11.01x11.35x1.64x9.91x15.4%N/A
HIG (Hartford — commercial/personal/group benefits)8.93x9.36x1.88x7.07x22.7%16.70%
CINF (Cincinnati Financial — regional P&C, 65-yr dividend grower)9.02x17.98x‡1.55x6.59x18.7%14.12%
Peer median8.93x10.48x1.80x6.70x22.7%16.70%
PGR vs. median+8.4%+14.7%+92.8%+17.8%+15.2pp−1.9pp
Sources: 1 9 10 11 12 13
†ALL's trailing P/E of 4.55x is unusually low; the TTM period may include large non-recurring gains. ‡CINF's forward P/E of 17.98x implies analyst consensus expects a significant EPS decline; this figure is an outlier.
Three observations from this table:
P/B premium is real and requires explanation. PGR's P/B of 3.47x is 92.8% above the peer median of 1.80x. The justification is straightforward on paper: PGR's ROE of 37.9% is more than double the peer median of 22.7%, and higher-return businesses command higher book value multiples. The risk is that if ROE normalizes toward the peer median (say 20–25%), the P/B ratio would need to compress proportionally — which, at a constant book value, implies significant price downside. P/B 5-year history shows this dynamic clearly: PGR's P/B averaged 4.11x (5-year mean) but has already fallen from a peak of 5.38x in Q1 2025 to the current 3.47x as the stock declined. 14
Trailing P/E premium vs. peers is modest (+8.4%). At 9.68x vs. the peer median of 8.93x, PGR carries only a small P/E premium on a trailing basis — suggesting the market is not fully crediting the ROE differential in the P/E multiple alone.
ROIC spread over WACC is substantial. PGR's ROIC of 30.26% against an estimated WACC of 5.65% produces a 24.6 percentage-point economic spread — meaning every dollar deployed in the business generates significant excess returns. 1 That level of economic value creation is typically associated with a higher earnings multiple, not a compressed one.

Balance sheet health

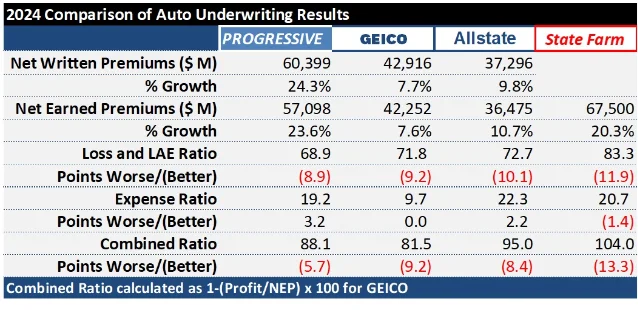
Four major auto insurers' 2024 underwriting results: combined ratio, loss ratio, expense ratio, and premium growth rate comparison chart
2024 underwriting results: Progressive's loss ratio of 68.9 versus GEICO ~71.9, Allstate ~72.9, and State Farm ~82.9. 15
MetricFY2023FY2024FY2025Q1 2026
Total debt$8,390M$8,386M
Stockholders' equity$20,277M$25,591M$30,323M$32,039M
D/E ratio0.28x0.26x
Interest coverage (tax basis)~53x50.9x
Favorable prior-year reserve development$451.0M
Sources: 6
Progressive runs a conservative balance sheet for an insurance company. Debt-to-equity of 0.26x and an interest coverage ratio of 50.9x (Q1 2026 pre-tax income of $3,566M / $70M interest expense) leave the company with exceptional financial flexibility. 6 The primary balance sheet event in recent months was a $1.5B debt issuance in March 2026: $500M of 4.60% notes due 2031 and $1.0B of 5.15% notes due 2036, used in part to pre-refinance $1.0B of notes maturing in 2027 (two tranches of $500M each at 2.45% and 2.50%). The 2027 maturity represents 11.9% of total debt — easily managed at current earnings levels. 16
Credit ratings confirm the balance sheet quality. AM Best affirmed Progressive's operating subsidiaries at A+ (Superior) financial strength with a stable outlook on May 1, 2026. 16 Fitch Ratings confirmed operating subsidiary IFS at AA (Very Strong) and senior unsecured debt at A, stable outlook, on May 29, 2026. 17 S&P's last published action (May 2024) was also investment-grade; no downgrade action has been publicly reported since.
Reserve adequacy — a critical leading indicator for insurance earnings — improved further in Q1 2026. Prior-year reserve development was favorable by $451.0M in Q1 2026, compared with $278.0M favorable in Q1 2025. 6 Favorable development means Progressive set aside more for prior claims than it ultimately paid — a sign of conservative reserving practices.

Competitive moat — two decades of telematics data and a 10-point CR advantage

Progressive's competitive advantage operates on two reinforcing layers. The first is visible in the underwriting numbers: a combined ratio of 87.4 (FY2025) versus the P&C industry's estimated 95.0 means Progressive retains roughly $7.60 more profit per $100 of premium than the average competitor. The second is structural: Progressive has been collecting real-time driving data through its Snapshot telematics program for nearly 20 years. 18
In FY2024, Progressive's loss ratio was 68.9 — versus GEICO (Berkshire Hathaway subsidiary, personal auto insurer) at approximately 71.9, Allstate at approximately 72.9, and State Farm at approximately 82.9. 15 That 14-point gap against State Farm is not cyclical variance; it reflects a decade of systematic pricing improvement driven by behavioral data that Progressive's competitors do not have at comparable scale or duration. Snapshot now monitors driving behavior continuously across 14 states covering 44% of TTM net written premiums — speed, acceleration, braking, and phone use translated into individualized risk scores. 2
The market share trajectory amplifies the moat. Progressive held approximately 13.3% of the U.S. personal auto market at the start of 2024; by Q1 2026, that share had grown to 18.6%, adding 3.4 percentage points in two years. 2 Personal Lines President Pat Callahan described it this way on the Q1 call: "It took us 84 years to get to 15.2 points of U.S. auto market share and only 2 years to add another 23% more on top of that." 2 More customers generate more data, which sharpens segmentation, which improves pricing, which attracts more customers. CEO Griffith described it directly: "When we get more customers, we gather more data. When we gather more data, we understand segmentation and risk to rate better... it's a very nice flywheel that we've used for a long time." 2
One genuine gap in the competitive picture: JD Power's 2025 U.S. Auto Insurance Study gave Progressive an average score of 621 out of 1,000 — below State Farm (650), GEICO (645), Allstate (635), and the industry average (644). 15 Progressive is winning customers through price and availability, not through service satisfaction — a vulnerability if satisfaction-sensitive customers churn at higher rates once they can find comparable pricing elsewhere.

Risk factors

1. Growth deceleration and earnings normalization
Net written premium growth has fallen from 21% (FY2024) to 4% in January 2026. 5 The forward P/E of 12.02x reflects analyst consensus EPS of approximately $15.84 for the next fiscal year — a 19.4% decline from TTM EPS of $19.66. 1 That would imply combined ratio widening from the current ~86–87 range back toward the 90+ level as competitive pressure on pricing intensifies. This is the central risk: whether the exceptional profitability of FY2024–FY2025 was a sustained re-rating of Progressive's business, or a temporary peak in the underwriting cycle.
2. Bodily injury (BI) claim severity — the structural headwind
The CCC Crash Course 2026 industry report, released April 13, 2026, found that bodily injury claim frequency has risen 11% over the past two years — the only major coverage line to increase while others fell. 19 Average vehicle repair costs have risen from roughly $2,500 (2010) to $4,500–$5,000 today. Social inflation — jury awards and litigation settlements above actuarial loss trends — was running at 6.3% annually as of 2023. 19 These pressures do not create one-time hits; they compress combined ratios systematically over time if not offset by rate increases. Progressive's Q1 2026 CR of 86.4 was slightly worse than Q1 2025's 86.0, a 0.4-point deterioration. 6 The company remains far ahead of industry averages, but the direction of travel matters.
3. CFO transition (July 2026)
CFO John Sauerland, who has held the role for 10 years and been with Progressive for 35 years, retires July 3, 2026. He is being succeeded by Chief Strategy Officer Andrew Quigg. 4 Quigg is an internal promotion with deep familiarity with Progressive's business; the transition risk is primarily that the company will navigate a simultaneous leadership change and an increasingly competitive market environment in the same window.
4. Insider selling — 100% sell-side activity
Finviz records no public market purchases by Progressive insiders in the past six months, against approximately $2.6M in disclosed open-market sales. The most active sellers include CIO Jonathan Bauer ($1.1M across two transactions), Commercial Lines President Karen Bailo ($746K), and incoming CFO Quigg himself ($337K in January 2026). 7 Insider ownership is low at 0.27% of shares outstanding, so the dollar amounts are small relative to the business — but the absence of any open-market buying at a 52-week low, particularly by the incoming CFO, is a data point to weigh.
5. P/B premium exposure
At P/B 3.47x versus the peer median of 1.80x, approximately half of PGR's stock price is supported by an ROE premium that must be sustained to justify the book value multiple. If combined ratios normalize to, say, 92–93 and ROE drops to the 20–25% range, the P/B compression alone (from 3.47x to ~2.0–2.5x) would represent a 30–40% headwind on the book-value component of the valuation, all else equal. This is a structural risk embedded in the current price, not a short-term catalyst.
6. Litigation — manageable but ongoing
Progressive settled two class-action total-loss vehicle valuation cases in 2025–2026: $48M (New York, Volino v. Progressive) and $43M (Georgia, Brown v. Progressive Mountain), combined $91M. 20 The $91M total represents 0.08% of FY2025 net income — not material. The Illinois federal court rejected certification of a similar class action in April 2026, and the Third Circuit dismissed another in July 2025. No active regulatory investigations specific to Progressive were identified in this research cycle.

Near-term catalysts and market context

Dividend — variable and currently very large. Progressive uses a variable dividend structure: a fixed $0.10/quarter plus an annual variable dividend declared in January based on the prior year's earnings. For FY2025, the variable dividend was $13.60/share (paid January 2, 2026), bringing the full-year dividend to $13.90/share. 21 At the current $190.40 price, that annualized dividend produces a 7.30% yield — but this is not a recurring fixed yield. The FY2025 variable dividend was exceptionally large because FY2025 earnings were exceptionally large. If earnings normalize to the analyst consensus ($15.84 EPS), the FY2026 variable dividend would likely be substantially smaller. For context: FY2023 variable was $0.85/share, FY2024 was $4.60/share, FY2025 was $13.60/share. The $0.10 quarterly fixed component (next ex-dividend date July 2, 2026) is the only guaranteed component. Investors who purchased PGR for the 7.30% yield should understand this policy structure. 21
Analyst consensus. 25 analysts covering PGR carry a Hold consensus with an average 12-month price target of approximately $231–$234, implying roughly 21–23% upside from current levels. 1 7 Notable recent actions: Barclays upgraded to Overweight with a $265 target in January 2026; Morgan Stanley, Wells Fargo, BMO Capital, and Evercore ISI all downgraded in late 2025 reflecting concerns about growth deceleration; Bank of America maintained Buy on May 21, 2026. Analyst targets carry systematic optimism bias — use directionally, not as price floors.
Q2 2026 earnings are expected in early August 2026. Key variables to monitor: net written premium growth rate (whether the 4% January 2026 reading persisted or recovered), combined ratio trajectory (Q1's 86.4 versus Q1 2025's 86.0), and any guidance update from the incoming CFO Quigg on the 2026 capital allocation priorities, including the estimated $2.4B share buyback pace cited by BMO Capital. 5
Catastrophe environment remains benign. The 2025 Atlantic hurricane season produced no U.S. landfalling hurricanes, and Q1 2026 global insured catastrophe losses of approximately $20B ran 26% below the 10-year average. 22 Progressive entered the 2026 hurricane season (June 1 – November 30) with $300M of aggregate excess-of-loss reinsurance coverage (including a $125M catastrophe bond, Bonanza Re Ltd.), a $175M shared hurricane limit renewal, and a first-loss retention of $550M per event. 22 A severe 2026 hurricane season would test the retention layer; a second consecutive mild season would be an earnings tailwind.
52-week range. $189.20 (low) – $289.96 (high). The May 29 close of $190.40 is within $1.20 of the 52-week low. The RSI at 34.77 is approaching but has not yet reached the technical oversold threshold of 30. 7 Short interest is 1.19% of the float — 6.96 million shares, 2.4 days to cover — well within normal range and below the P&C industry average of 2–4%. 7

Thesis in brief — opportunity and risk structure

PGR passes all three screening criteria: ROE of 19.25% / 33.14% / 37.29% for FY2023–FY2025 (SEC EDGAR verified); three years of positive and growing FCF ($10.4B / $14.8B / $17.2B); and a trailing P/E of 9.68x that sits 46% below its own 5-year median. 3 8
The opportunity: Progressive is the only U.S. insurer with nearly 20 years of real-time driving data at scale, a 9–10 point combined ratio advantage over the industry, a FCF yield of 14.76%, and a market cap that has fallen 34% while earnings grew 33% over the same twelve months. The ROIC-WACC spread of 24.6 percentage points is among the highest in the financial sector — more capital is being deployed profitably than almost any comparably sized insurance or financial business. The low beta of 0.30 means the stock's drawdown has been largely independent of the broader market's strength in the same period. 1
The risk: The stock price reflects an earnings normalization scenario that analysts, taken together, believe is coming. Forward EPS consensus implies a 19% decline in per-share earnings — which, if correct, would push the forward P/E to roughly 12x, still below the historical median but not the 9.68x screen-catching value it appears at on TTM earnings. The P/B of 3.47x — 93% above peer median — requires sustained ROE above 30% to be defensible on a book value basis. The CFO transition in July 2026 removes a known, trusted voice from the capital allocation process during a period when competitive dynamics are shifting. Variable dividend income of $13.90/share in the current year is likely to be significantly lower in the next.
The specific data point to verify against the Q2 2026 report: whether the combined ratio is holding below 90 and net premiums written growth is recovering from the 4% January pace. If Q2 shows CR in the 87–89 range and NWP growth reaccelerating toward 8–10%, the normalization narrative weakens and the valuation discount becomes harder to justify. If CR widens above 92 and growth stalls, the forward earnings estimate is directionally correct and the current price reflects fair value rather than undervaluation.
All financial data sourced from SEC EDGAR XBRL filings (CIK 0000080661), StockAnalysis, Finviz, Macrotrends, and the additional sources cited above. Price data represents the May 29, 2026 close. This article is for research purposes only and does not constitute investment advice. Verify all data independently before making any investment decision.
Cover image: AI-generated illustrative image

围绕这条内容继续补充观点或上下文。

  • 登录后可发表评论。