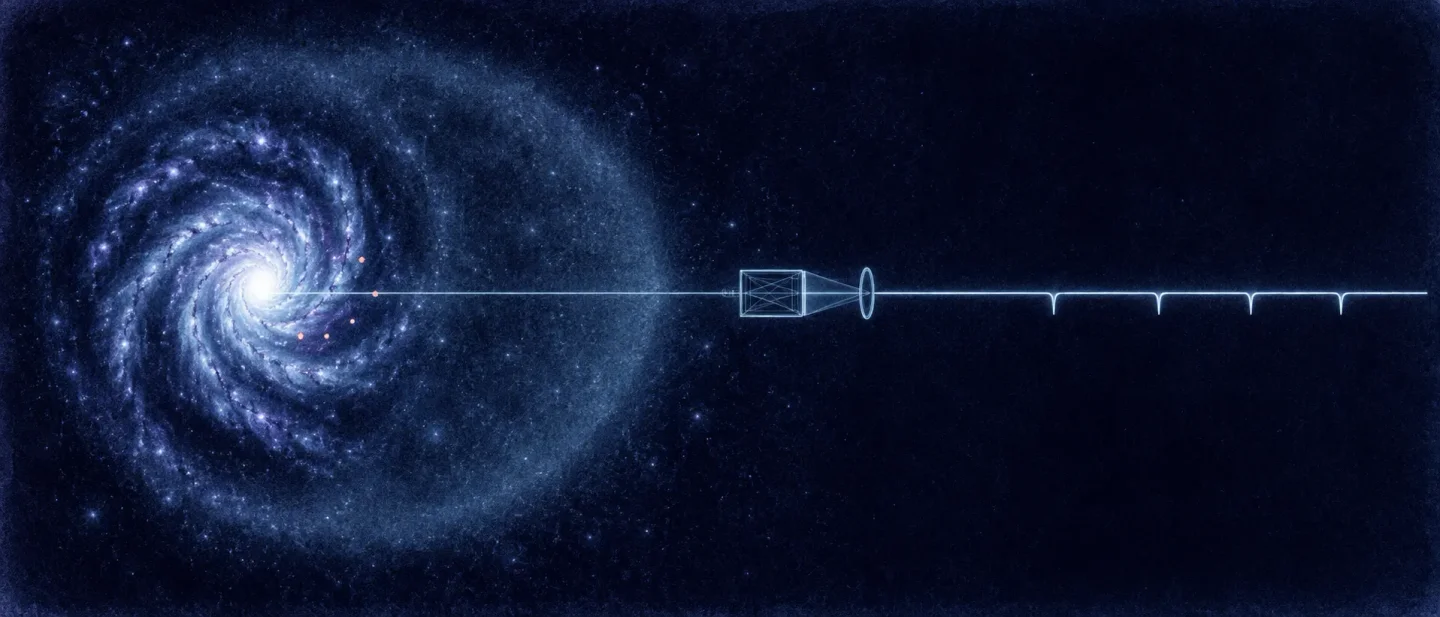
Ten halo-gas updates: a 0.5% X-ray filling factor, kSZ gas fractions, where the Lyα forest goes dark, and a WHIM fraction cut by more than half
Ten papers show how much of a halo's gas each probe actually reaches, from an X-ray filling factor of half a per cent to a warm-hot fraction that halves once the grid resolves the gas, and which observed values survive the correction.

Three of this week's ten items set a measured quantity against a model of the same gas. Four generate their observable from a simulation and stop there. Three report measurements with no simulation in the comparison. 12345678910
The first four entries work the same question from different ends. Li et al. fit X-ray spectra and a Sunyaev–Zel'dovich profile of one nearby disk galaxy and conclude that the X-ray-bright gas occupies about half a per cent of its halo volume. Liu et al. measure an ionized-gas fraction around 6.7 million galaxies without assuming a profile shape, and six hydrodynamical simulations land on either side of that measurement. Shavelle et al. supply the profile such a comparison needs and show what it costs: three parameters, with the choice of X-ray data set moving a characteristic halo mass by half a dex. Chen et al. read the depth of the cool circumgalactic medium off the velocity field of its emission.
A probe returns a fraction of a halo's gas, and what the inference does with the rest is the week's question. Where the fraction is small the correction is large: the filling factor of about 5 × 10⁻³ that Li et al. infer puts the halo's hot-gas mass about 2.5 times above the single-phase value and its thermal energy about ten times above it. Where the fraction has not been resolved, the correction passes unnoticed. Re-binning one simulation output by a factor of four along each axis moves the share of cosmic baryons in the warm-hot phase from 23.4% back up to 46.7%, into the range that coarser runs have reported for years.
The order below keeps the low-redshift comparison work at the front and the two machine-learning items at the end.
Quick look
The class in each row reads as follows: (a) a synthetic observable set against real data, (b) a benchmark at the level of physical quantities, in which a model or a measurement is set against hydrodynamical runs and the mock spectra are left aside, (c) a synthetic-only result, with no observed counterpart of the synthetic observable in the comparison, (d) an observational anchor, a real measurement with no simulation in the comparison.
| Work | Class and redshift | Comparison level | Result to screen on | Code and data |
|---|---|---|---|---|
| Li et al., ApJ 1009, 72 | (d) observational anchor; local disk galaxy | XMM-Newton MOS spectra of the Sombrero's halo against five independent Planck-based SZ reconstructions | The X-ray-predicted SZ profile is 0.06 to 0.08 of the measured one at r ≈ 50 kpc, which a two-phase reading turns into a filling factor of (4–6) × 10⁻³ 1 | No repository and no data DOI printed 11 |
| Liu et al., arXiv:2609.22466 | (b) physical-level benchmark; z̄ = 0.26 and 0.4 < z < 1.1 | One aperture filter applied to an ACT DR6 kSZ map and to the HSC Y3 shear of the same DESI DR2 lenses, then set against six hydrodynamical runs | Baryon depletion at SNR = 17.1 (BGS) and 15.8 (LRG bin 1); no single prescription matches across all nine radial bins 2 | No code released; no data DOI for DESI DR2, ACT DR6 or HSC Y3 12 |
| Shavelle et al., arXiv:2609.21861 | (b) physical-level benchmark; z̄ ≈ 0.55 | A three-parameter two-component gas profile fitted jointly to CMASS–ACT kSZ and one of two X-ray gas-fraction samples | kSZ fixes the diffuse extent at θ_d ≈ 5.1 R200 in both fits; the X-ray sample moves the characteristic mass from log₁₀ M_c = 13.81 to 14.38 3 | No code; Data Availability names five simulations with no URLs 13 |
| Chen et al., arXiv:2609.20929 | (a) synthetic observable against real data; z ≈ 0.5–3 | Mock integral-field moment maps of isotropic turbulence against 11 observed circumgalactic nebulae | Observed σ_los/σ_pos of 1 to 2.5 maps onto L_los ≈ 0.1–5 L_neb 4 | No repository cited; TurboGenPY public with no tagged release 14 |
| Moghni et al., arXiv:2609.23288 | (d) observational anchor; z ≈ 0 | MaNGA integral-field Na I D and Ca II K absorption in 140 red geysers and 140 matched controls | Ca II covers up to 6 times the area of Na I D; 20% of Na I D detections reach beyond the dust against 70% of Ca II ones 9 | No code, catalogue or data release 15 |
| Soares da Silva et al., arXiv:2609.19235 | (c) synthetic-only; z ≈ 3 | TNG50-2 Lyα skewers split into high-column-only and forest-only channels | DLAs hand over to sub-DLAs at b ≈ 0.11 R200c, sub-DLAs to LLSs at 0.3, LLSs to the forest at 0.5 5 | Public repository, MIT, newest commit 7 August 2026, no tags; catalogues promised on Zenodo 16 |
| Wang & Cen, arXiv:2609.21784 | (c) synthetic-only; z = 0 | Kratos unigrid 4096³ in a (100 h⁻¹ Mpc)³ box, with synthetic Lyα, O VI, O VII and O VIII emission | The warm-hot phase holds 51.4% of cosmic baryons at a 512³ grid, 23.4% at 4096³, and 46.7% when the 4096³ output is rebinned by four 6 | Data on reasonable request; Kratos supplied only on request 17 |
| Fei et al., arXiv:2609.17680 | (d) observational anchor; z = 7.03 | JWST/NIRSpec and NOEMA spectra of an absorber and its host at 16 kpc | Mg II λ2796 rest-frame W₀ = 3.33 ± 0.08 Å and log N(Mg II) = 14.28, the largest equivalent widths reported at z > 5 10 | Four MAST data DOIs; no code; the NOEMA data carry no DOI 18 |
| Ogle et al., arXiv:2609.22543 | (c) synthetic-only; z = 0 | A set network over a galaxy catalogue fused with a convolutional network over X-ray images, both on TNG300 mocks | log₁₀ M500c to 0.056 dex against 0.104 dex (catalogue alone) and 0.072 dex (image alone); f_gas within R200c to 0.0074 dex 8 | Code, configurations and per-trial arrays public; trained weights absent 19 |
| Nagamine et al., arXiv:2609.23982 | (c) synthetic-only; z = 0 to 2; decrement normalised to a measured mean flux | GADGET4-Osaka runs of the Osaka feedback model, with the mean Lyα decrement around galaxies and a frozen TNG-trained graph network | The decrement falls from 0.279 ± 0.013 at 62 h⁻¹ ckpc to 0.049 ± 0.012 at 4.2 h⁻¹ cMpc; the frozen network returns Ω_m with 0.132 dex of scatter where it managed 0.035 in-distribution 7 | Data private; release promised through CAMELS with no URL and no date 20 |
Every entry below carries the same five fields: sample and observable, method and result, real-data stage and caveat, code and data, and why open it.
1. Li et al.: the X-ray-bright gas fills half a per cent of the halo
Jiang-Tao Li, Rui Huang, Joel N. Bregman, Q. Daniel Wang and Cameron Pratt posted A Possible Hidden Hot Halo Component Revealed by Joint X-ray and Sunyaev–Zel'dovich Observations on 15 September at 8:49 p.m. Central Time, and the Astrophysical Journal published it on 18 September. The journal release is the new event. 1
Sample and observable. NGC 4594 is the Sombrero Galaxy, the most massive isolated disk galaxy inside roughly 30 Mpc, with a halo mass near 10¹³ M☉. The X-ray side is MOS1 and MOS2 spectra from XMM-Newton, taken from concentric annuli centred on the nucleus and covering to r ≈ 100′, with the pn detector dropped because its background is less stable for faint diffuse emission. The exposure comes from XART-ATOMS, a four-pointing Large Program, plus one archival offset field for the background. Fitting those spectra gives radial emission-measure and temperature profiles; a β-model for the electron density and a characteristic temperature of 0.75 keV turn that into a thermal-pressure profile, and projecting the pressure along the line of sight predicts the Compton-y profile this gas would produce. On the other side sit radial y profiles from five independent Planck PR4-based reconstructions, with the inner r < 10′ excluded so that the optical galaxy, the central radio source and its lobes stay out of the stack. 11
Method and result. Everything is quoted at r = 10′–20′, which is r ≈ 50 kpc. The ratio of the predicted to the measured Compton-y profile is a = 0.08 across all five maps and three assumed metallicities, and 0.06 for the authors' preferred map at 0.3 Z☉. In their Monte Carlo treatment the measured signal exceeds the prediction with about 86% probability in the first case and 94% in the second, and those probabilities fall to about 63% and 68% when the whole X-ray radial range, r ≲ 330 kpc, is included. The two-phase reading of that gap, under approximate pressure equilibrium, gives a filling factor f_X of (4–6) × 10⁻³ at r ≈ 50 kpc, and the filling factor sets both corrections: a hot-gas baryon mass about 2.5 times the single-phase value, and a thermal energy higher by about an order of magnitude. The authors' own consistency check runs the other way. The two-phase model predicts a luminosity bias of 7 to 8, while the X-ray spectra allow 90% upper limits of only 1.2 to 2.5 against it, so a hotter component sharing the spatial distribution of the detected gas would be difficult to hide.
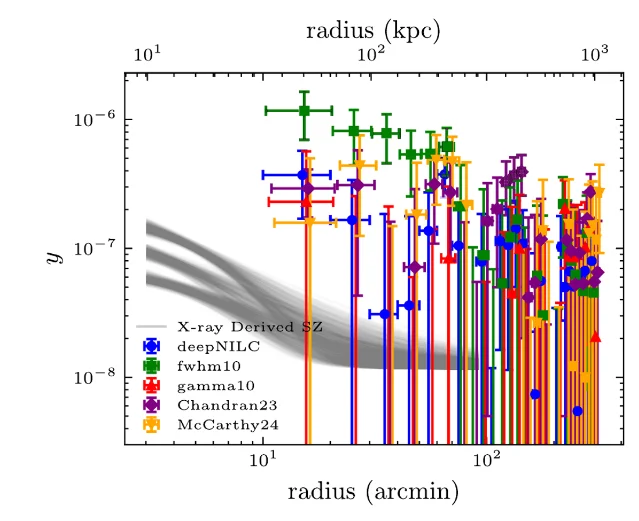
Real-data stage and caveat. Real XMM-Newton photons are fitted, and the resulting pressure profile is compared with real Planck-based maps; no simulation and no mock data enter the comparison, and the two-phase structure is handled by an analytic toy model. The authors state that a smaller intrinsic discrepancy, a scenario where the X-ray and SZ signals come largely from the same gas, and a nonthermal contribution from an extended population of fossil radio lobes all remain open. The nonthermal alternative would need deep low-frequency radio imaging to settle, and at r ≈ 50 kpc the X-ray surface brightness is already low enough that systematics dominate its side of the comparison. Two further items are worth knowing before quoting a number: the paper states no redshift and no single distance, and its text quotes about 390 ks of effective MOS exposure where the five rows of its own Table 1 sum to 737 ks.
Code and data. The paper prints no repository, no archive link and no data DOI. The observations are from an XMM-Newton Large Program and the SZ maps are published reconstructions, but neither is addressed here by a locator a reader can follow. 11
Why open it. It is the clearest worked example of a single-phase X-ray gas mass becoming a lower limit, and its own numbers cap the size of the correction: a filling factor near 5 × 10⁻³ at 50 kpc, and a hidden phase that the spectra would have to be fainter than the spectra allow.
2. Liu et al.: the gas fraction measured without a profile, against six simulations
R. Henry Liu, Uroš Seljak, Simone Ferraro, Boryana Hadzhiyska, Frank J. Qu and 50 colleagues from the Dark Energy Spectroscopic Instrument collaboration posted Model-Independent Measurement of Baryon Gas Fractions through Galaxy-Galaxy Lensing and the Kinematic Sunyaev–Zel'dovich Effect on 18 September at 1:23 p.m. Central Time. The preprint carries no journal reference yet. 2
Sample and observable. The lenses are DESI Data Release 2 galaxies in two classes: the bright galaxy sample, selected at r < 20.2 mag, with mean redshift z̄ = 0.26 and 2,224,546 stacked objects, and luminous red galaxies in four bins between 0.4 and 1.1 with mean redshifts of 0.51, 0.71, 0.87 and 1.01 and 1.05, 1.61, 1.28 and 0.52 million objects. The kSZ side is the ACT DR6 night-time component-separated maps, 0.5 arcmin pixels with a 1.6 arcmin beam, for which only ionized gas contributes. The lensing side is the HSC Year 3 shear catalogue at an effective source density of 19.9 per square arcminute. 12
Method and result. The measurement applies one and the same aperture filter to a velocity-weighted ACT temperature stamp and to the HSC shear field, then takes the ratio bin by bin over nine angular bins from 1 to 6 arcmin, roughly 0.3 to 6 comoving Mpc at these redshifts. Because both filtered signals have the same functional form, the ratio needs no assumed profile and no halo-mass calibration. Against a uniform gas fraction of 1, the profile is depleted at a signal-to-noise of 17.1 for the bright sample and 15.8 for the lowest-redshift red-galaxy bin. The beam compensation that recovers the intrinsic small-scale amplitude is calibrated on six hydrodynamical runs, Illustris-1, TNG300-1, SIMBA-100 and three FLAMINGO variants, which predict nearly identical suppression curves, so the correction itself carries little feedback dependence. The comparison that follows uses the same six runs. At the smallest apertures the data sit between Illustris-1, which depletes too much, and TNG300-1, which depletes too little, with SIMBA-100, the fiducial FLAMINGO run and the jet-feedback variant closest to the measurement. All of them converge toward the cosmic baryon fraction at large apertures, and the paper's conclusion is that no single feedback prescription reproduces the profile across the full radial range. One redshift bin carries a residual systematic: for the second luminous red-galaxy bin the difference between the North and South Galactic Cap measurements is χ² = 15.08 for 9 degrees of freedom, a probability to exceed of 0.089. 12
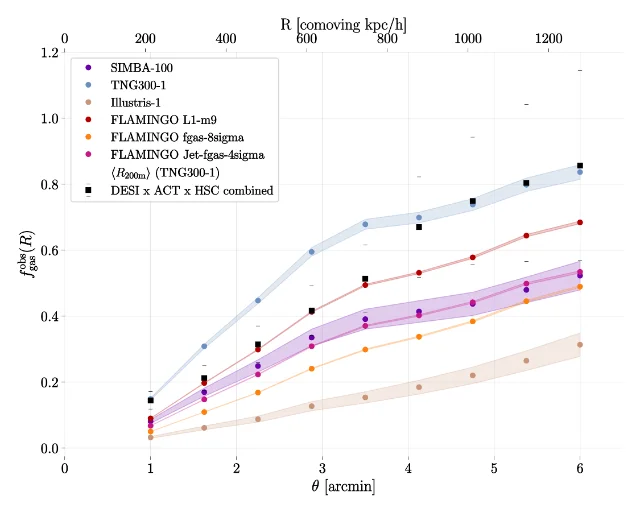
Real-data stage and caveat. Both halves of the ratio are measured, from DESI, ACT and HSC, and the paper fits no profile and no mass relation to either. The caveats are the price of that construction. The raw observable is the beam-suppressed ratio, and the beam-compensated version is calibrated on simulations, so at the smallest radii the correction makes the result less than fully model-independent. The quantity itself is a differential, filtered ratio of ionized gas to total matter, which differs from a cumulative gas fraction in both its projection and its filtering, and kSZ sees only the ionized component of the baryons. A low ionized-gas fraction can mean gas was expelled, or that baryons are locked in stars or sitting neutral, and the two produce the same kSZ signature; the simulations differ in stellar content by factors of a few, which complicates reading feedback strength directly off the comparison.
Code and data. The paper releases no analysis code and gives no data DOI or archive address for the DESI, ACT or HSC products it uses, referring to them through their own papers. Its lensing profiles are stated to be consistent with an earlier DESI DR1 by HSC analysis, and the companion paper that builds the mock side of the comparison is described as in preparation. 12
Why open it. This is a template for comparing a simulation with a measurement rather than with another model. The same filter on both probes removes the profile assumption from the measurement, and the residual, the beam correction, is shown to be nearly feedback-independent across six runs.
3. Shavelle et al.: three parameters to connect the X-ray gas and the kSZ gas
Kaitlyn Shavelle, Jared Siegel, Leah Bigwood, Alexandra Amon and Romain Teyssier posted A two-component profile of baryonic feedback: hydrostatic and diffuse gas on 18 September at 9:53 a.m. Central Time and submitted it to Monthly Notices of the Royal Astronomical Society. 3
Sample and observable. The model, which the authors call HyDif, replaces the single hot-gas term of the Schneider and Teyssier baryonification framework with two components: an inner term shaped like a hydrostatic halo and an outer diffuse term. Its component fraction ties the two amplitudes to the halo mass and the total hot-gas budget, which leaves three free parameters, a characteristic mass log₁₀ M_c with a flat prior from 11 to 15, the slope μ of the component fraction from 0 to 2, and the diffuse extent θ_d in units of R200 from 2 to 8. Everything else, the central galaxy, the collisionless matter, the stellar fractions and the two-halo term, is fixed. The observables each parameter is meant to answer are the two ways of weighing halo gas: X-ray emission, which scales as density squared and therefore weights the dense inner gas, and the kSZ effect, which integrates the thermal pressure of ionized gas out to larger radii. 13
Method and result. One joint fit per X-ray sample uses the stacked CMASS kSZ profile from ACT at 150 GHz, with a 1.3 arcmin beam at mean redshift 0.55 and an assumed mean halo mass of log₁₀[M200/(h⁻¹ M☉)] = 13.34 ± 0.04, together with either the HSC-XXL X-ray gas fractions or four gas-fraction bins from eROSITA's eRASS1 release. The kSZ profile pins the diffuse extent in both fits, at θ_d = 5.15 for HSC-XXL and 5.14 for eROSITA. The X-ray sample then moves the rest of the posterior: log₁₀ M_c is 13.81 (+0.22/−0.11) with HSC-XXL and 14.38 (+0.09/−0.08) with eROSITA, with μ at 1.43 and 0.69 respectively. Half a dex in a characteristic mass is the practical size of the disagreement between the two X-ray gas-fraction samples once a three-parameter profile is asked to absorb it. The HSC-XXL fit marginally misses the lower-mass X-ray point, and the joint eROSITA fit describes the gas fractions well. Five hydrodynamical runs, FLAMINGO, BAHAMAS, SIMBA, FABLE and XFABLE, are used at z = 0 in the 13.25 to 13.35 bin in log₁₀(M500/M☉) as a check that a fixed two-component shape can reproduce the spread of gas distributions that different feedback implementations produce. That check is quoted on the M500 scale, which is a different mass definition from the M200 = 13.34 that anchors the kSZ fit. No χ² is reported, and the fit quality is described in words throughout. 13
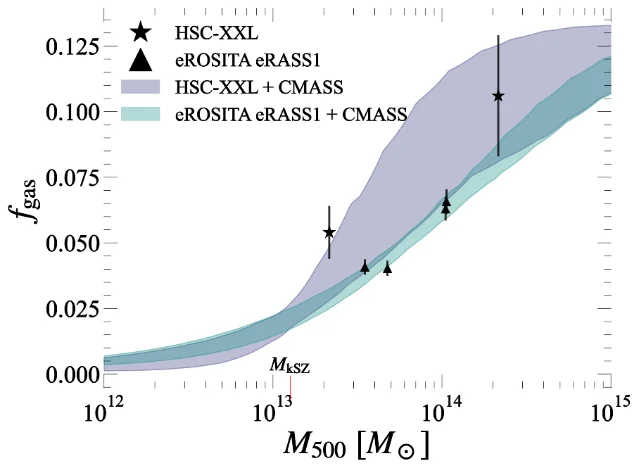
Real-data stage and caveat. Both fits target real measurements, and no synthetic spectrum is produced. The authors call the exercise a proof of concept in three separate places, and the limitations they list follow from that: only the hot gas is modelled, with stars, the central galaxy and dark matter held fixed, so a self-consistent baryonic budget and any weak-lensing or matter-power prediction are left to later work; the validation covers a single halo-mass bin at z = 0; and the question of whether the X-ray and kSZ measurements can be made consistent is deferred. The kSZ constraint is dominated by the innermost bins because of the measurement covariance.
Code and data. The paper prints no repository and no data URL. Its Data Availability statement names FLAMINGO, BAHAMAS, SIMBA, FABLE and XFABLE as publicly available and gives no locator for any of them, and the kSZ, HSC-XXL and eROSITA measurements are reached through their own papers. 13
Why open it. It is the model side of the same comparison Liu et al. make from the measurement side: where that paper removes the profile assumption, this one shows how few parameters a profile needs, and what it costs when two X-ray data sets disagree.
4. Chen et al.: the cool circumgalactic medium is about as deep as it is wide
Mandy C. Chen, Michael Rauch, Zhijie Qu, Gwen C. Rudie, Hsiao-Wen Chen and James R. Beattie posted From IFS Maps to 3D Structure I: Constraining Geometry in the Circumgalactic Medium on 17 September at 1:00 p.m. Central Time and submitted it to AAS Journals. A companion paper on turbulence diagnostics is announced in the text and is not on arXiv yet. 4
Sample and observable. The observational side is 11 circumgalactic nebulae: eight systems at z ≈ 0.5 to 1 observed with VLT/MUSE and three at z ≈ 1.6 to 3 observed with the JWST/NIRSpec integral-field unit, all compiled from data sets published earlier. Each nebula contributes exactly two scalars. The first, σ_pos, is the dispersion of the line-centroid map after a best-fit large-scale velocity gradient has been removed, which puts it in the plane of the sky. The second, σ_los, is the root-mean-square of the per-spaxel emission-line velocity-dispersion map, which puts it along the line of sight. The synthetic side projects intensity-weighted centroid and line-width maps through emitting slabs, taking 20 well-separated 768³ sub-cubes from a stationary forced isotropic turbulence database with a global Reynolds number of about 1300, adding Gaussian random field cubes at spectral slopes of 1, 4/3, 5/3 and 2, and pooling all emitting elements inside a beam of FWHM 0.1 L_neb before re-extracting the velocity moments. 21
Method and result. The measured ratio of line-of-sight to plane-of-sky dispersion lies between about 1 and 2.5. For a volume as deep as it is wide, the analytic Kolmogorov expectation for that ratio is 1.3, a value the observed band contains. Reading the band off the calibrated envelope, which includes the beam averaging, puts the line-of-sight depth at 0.1 to 5 times the nebular extent on the plane of the sky, and the paper's conclusion is that these nebulae are neither sheets nor strongly elongated. A sphere instead of a slab would return a ratio about 20% lower, near 1.04, and about 1.2 with the beam applied. Beam smoothing biases the measured ratio upward, and for the best-measured system, TXS 0206−048, the intrinsic ratio sits about 20% below the observed one; the authors do not carry that correction through the rest of the sample. The second result is a limit. Combining clump incidence rates from absorption-line surveys, which run at 0.02 to 0.2 absorbers per kiloparsec, with literature clump radii of about 100 pc and beam sizes of 1 to 10 kpc, each resolution element aggregates 10² to 10⁴ clumps, comparable to the best-sampled configuration in the mock grid. The observed dispersion ratios accordingly require at least 2 to 7 emitting elements per resolution element and carry no further information about their arrangement. 21
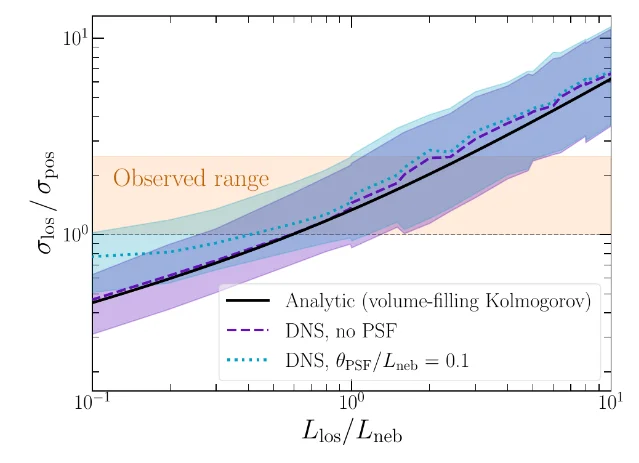
Real-data stage and caveat. Published integral-field observations supply the measured ratios, and the interpretation runs entirely through mock maps of idealized turbulence. The velocity field is incompressible, isotropic and homogeneous with no cooling, no hydrodynamics and no cosmological context, and the emitting volume is a slab at a fixed orientation. The variance-budget identity the diagnostic rests on holds exactly only for uniform emissivity with equal numbers of emitting elements per pixel. Varying the turbulence slope over a wide range moves the inferred depth by a factor of about 2 over most of the observed range and by about 4 as the ratio approaches 1.
Code and data. The paper cites no repository. Two of the tools behind the mocks are public: TurboGenPY, which generated the Gaussian random field cubes, resolves with 69 commits on its main branch and a most recent commit on 7 March 2026, and carries no tagged release; CloudFlex is named as the model the clump parameterisation follows, with a newest commit on 14 February 2025 and no tags. The 11 nebulae come from three earlier papers by the same group, and no per-object dispersion values are tabulated here. 1421
Why open it. It sets a ceiling on what emission-line kinematics can recover from the cool circumgalactic medium, and gives the depth-to-width ratio that absorption-line clump statistics have to be consistent with.
5. Moghni et al.: sodium sees the gas the dust protects, calcium sees the rest
Arian Moghni, Timothy M. Heckman, Namrata Roy, Kyle B. Westfall, Kevin Bundy and Kate H. R. Rubin posted Tracing Interstellar Gas in Quiescent Galaxies Using Na I D and Ca II H&K Absorption on 19 September at 8:50 p.m. Central Time and submitted it to the Astrophysical Journal. 9
Sample and observable. The sample is 140 red geyser galaxies, local quiescent systems that host low-luminosity active nuclei with bisymmetric ionized outflows, together with 140 matched quiescent controls. The data are MaNGA integral-field spectra, analysed spaxel by spaxel. Two interstellar absorption features are measured in each spectrum by Gaussian fitting: the Na I D doublet at 5891.58 and 5897.56 Å, the standard optical tracer of cool neutral gas for two decades, and the Ca II K line at 3934.78 Å, which traces neutral and ionized gas together and has been measured far less often. The measurement is down-the-barrel, an absorption line against each galaxy's own continuum, which puts the gas it samples in that galaxy's own interstellar medium. 15
Method and result. Calcium reaches much further than sodium. The Ca II reservoirs cover about 2.5 times the half-light area of the Na I D reservoirs in the red geysers and about 6 times in the controls, extend radially about 1.7 times as far, with median extents of 0.54 and 0.33 R50, and are about 1.7 to 1.8 times broader in line width. The split tracks dust. The area of the Na I D reservoir correlates with the area of the dust reservoir at r = 0.35 with p = 4.3 × 10⁻⁴, and its radial extent correlates with the dust extent at r = 0.38 with p = 0.0044, while neither correlation appears for Ca II, at r = 0.10 with p = 0.25 and r = −0.03 with p = 0.82. About 20% of the Na I D detections reach beyond the dust regions, and about 70% of the Ca II ones do. The authors read that as shielding: Na I has an ionization potential of 5.14 eV and survives only where dust blocks the radiation field, while Ca II at 11.87 eV needs no such protection. Depletion of calcium onto grains is an alternative contribution they acknowledge. 15
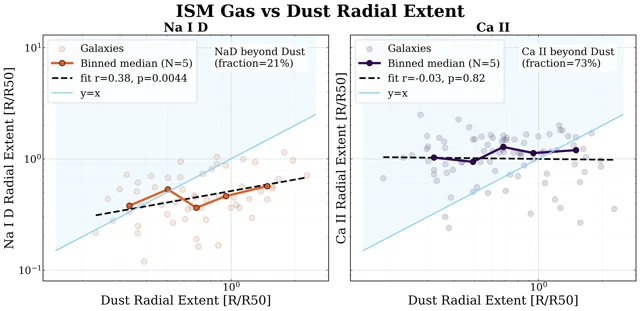
Real-data stage and caveat. Every number comes from fits to observed MaNGA spectra and from Balmer-decrement dust maps; the paper fits no model of the gas and runs no simulation. The authors' own caution is that the two tracers cannot be treated as interchangeable, and the quantities they report are partly relative: the reservoir extents are given in units of R50 and the line widths relative to the stellar width, with absolute areas in square kiloparsecs and widths in kilometres per second absent from the paper. The MaNGA data release is not named either, so anyone reusing the sample has to go through the cited companion analysis.
Code and data. The paper carries no data-availability statement, no software section and no repository URL. No catalogue, code package or data product accompanies it. 15
Why open it. Any comparison between a simulated cold-gas tracer and an observed absorption line inherits the shielding dependence this paper measures, and the size of the effect is a factor of several in the area each tracer reports.
6. Soares da Silva et al.: the virial radius sets where the forest goes dark
Victor R. Soares da Silva, Daniel López-Cano, L. Raul Abramo, J. Chaves-Montero and Francisco Maion posted Where the Forest Goes Dark: Halo-centered Characterization of High Column Density Systems with IllustrisTNG on 16 September at 12:04 p.m. Central Time. The preprint has no journal reference yet. 5
Sample and observable. The simulation is TNG50-2, a 35 h⁻¹ cMpc box at 1080³ resolution with 6.8 × 10⁵ M☉ per gas cell and 32 h⁻¹ ckpc of gas-cell spacing, and the production results come from one snapshot at z ≈ 3. The sample is 637 halos spanning three decades in M200c, from 10¹⁰ to 10¹³ M☉, pierced at 30 impact parameters between 0.01 and 50 R200c, for 363 skewers per halo and about 2.3 × 10⁵ skewers per resolution level, repeated over five halo-selection realizations. The synthetic observable is a one-dimensional Lyα transmission spectrum, computed only for the hydrogen Lyα transition at 396 pixels spanning 3961.5 km/s, which is a pixel width of 10 km/s, finer than the thermal width of 12.8 km/s for gas at 10⁴ K. The paper's distinctive step happens before the spectra are made: gas cells are grouped into high-column structures and deblended in velocity space with a watershed segmentation, and each sightline is then split into a high-column-only spectrum and its forest-only complement. 22
Method and result. The class of absorber a sightline records is set by its impact parameter measured in virial radii, and the sequence is compact. The five classes are the forest, Lyman-limit systems, sub-damped systems, and damped systems split into a small and a large sub-class. Damped systems hand over to sub-damped systems at b ≈ 0.11 R200c, sub-damped systems to Lyman-limit systems at 0.3, and Lyman-limit systems to the forest at 0.5, where the forest covers about 78% of sightlines at R200c and approaches full coverage only beyond about 20 R200c. Among the high-column classes, the sub-damped class peaks at b ≈ 0.14 R200c with a covering fraction of 0.42, and the Lyman-limit class peaks at 0.35 with 0.41; neither reaches half the sightlines. Over the three decades of halo mass the sequence keeps its shape, with the sub-damped and Lyman-limit peaks weakening from 0.50 and 0.45 in the lowest mass bin to 0.28 and 0.37 in the highest. The second result concerns what happens when a survey fits these systems. A single Voigt component recovers the column density of essentially every system above log N_HI ≈ 19, and for Lyman-limit systems it scatters over more than a decade, with worked cases 2.30 dex below and 1.58 dex above the measured column. Two resolutions below, at the innermost impact parameters, the split between small and large damped systems is the least converged quantity in the paper: the large-damped fraction inside 0.1 R200c is about 14% at TNG50-2, 29% at TNG50-3 and 46% at TNG50-4. 22
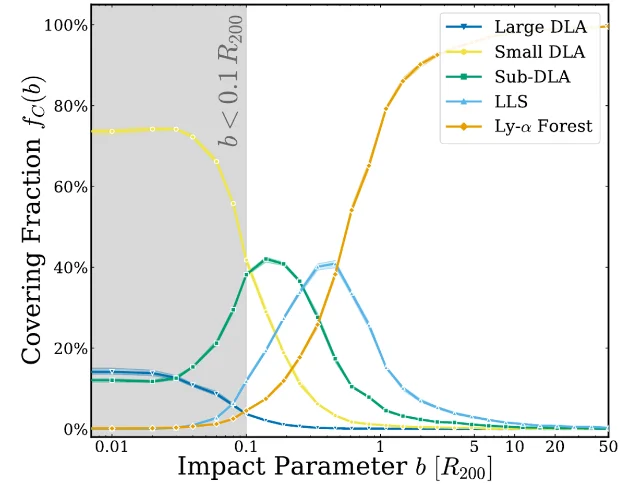
Real-data stage and caveat. No observed spectrum, catalogue or published measurement is compared with the model anywhere in the paper. The numbers that motivate it come from elsewhere, including the roughly 820,000 forests of DESI Data Release 2 and the finding that marginalising over Lyman-limit amplitudes inflates uncertainties on compressed parameters by about 50%. The authors' own limits are stated plainly: everything rests on one snapshot at z ≈ 3, while published forest analyses span 2 ≲ z ≲ 4, a range over which halo gas evolves; one baryonic model is used, so the sensitivity to subgrid physics is untested; results below 0.1 R200c are shown but not interpreted; and the class fractions depend on the boundaries chosen for the five classes. A related point about the construction is that sightlines carrying more than one retained system are classified by the summed column density.
Code and data. The repository named in the paper resolves and is public under an MIT licence, with eight commits and a most recent one on 7 August 2026; it carries no tags and no releases, and the README states that the data products are not versioned but regenerated by running the pipeline. The paper cites it twice, in a footnote and in its Data Availability statement, for the modified spectrum generator with the deblending step. The skewer catalogues are promised to Zenodo on publication, and no record exists there yet. The fork with the paper's deblending tag is public, and the paper itself does not name it. 1622
Why open it. Anything that forward-models high-column contamination in a Lyα forest analysis needs the class a sightline produces as a function of impact parameter, and this paper supplies that mapping together with the warning that the columns of weaker systems do not survive a single-component fit.
7. Wang & Cen: a warm-hot intergalactic medium fraction that halves when the grid resolves the gas
Lile Wang and Renyue Cen posted High Resolution Grid-based Simulations of the Warm-Hot Intergalactic Medium on 18 September at 8:57 a.m. Central Time, a 43-page preprint submitted to Science Bulletin. 6
Sample and observable. The fiducial run is a single uniform 4096³ grid in a (100 h⁻¹ Mpc)³ comoving box, evolved with the GPU-optimised grid code Kratos, at a spatial resolution of 24.5 h⁻¹ kpc comoving, which the authors say is enough to resolve the Jeans scale of gas at 10⁴ K and hydrogen densities of 10⁻³ to 10⁻² cm⁻³. The gas carries an imposed metal content up to 0.3 Z☉ and no dark-matter feedback. Around the fiducial run sits a resolution series at 512³, 1024³, 2048³ and 4096³, plus the fiducial output rebinned by a factor of four along each axis so that the same physics is viewed at a coarser grid. The synthetic observables are projected Lyα, O VI, O VII and O VIII emission maps. 23
Method and result. The warm-hot phase is defined here as gas between 10⁵ and 10⁷ K, weighted by mass. Its share of the cosmic baryons at z = 0 depends on the grid, and the figure legend gives the whole series: 51.44% at 512³, 36.35% at 1024³, 21.59% at 2048³ and 23.38% at 4096³, with 46.71% recovered when the fiducial 4096³ output is rebinned by a factor of four. The mechanism the authors give is cooling: resolving gas near its Jeans scale lets it reach higher densities, where radiative cooling moves baryons out of the warm-hot temperature range, and the remaining warm-hot gas sits in filaments and accretion-shock structures near halos. The authors describe convergence at the 2 percentage-point level between the two finest grids and flag cosmic variance at the several-per-cent level, since a single (100 h⁻¹ Mpc)³ realization underlies the series. The synthetic emission separates the tracers: O VI traces the interfaces between filaments and halos, while the X-ray lines, O VII and O VIII, probe hotter gas associated with massive halos, which is where the paper places the case for XRISM, Athena and HUBS.
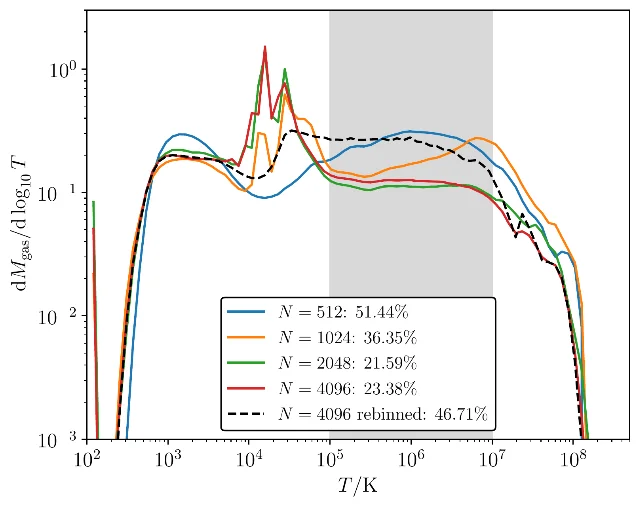
Real-data stage and caveat. The emission maps are predictions, and no measured surface brightness, column density or spectrum is compared with them anywhere in the paper. The authors defer instrumental forward modelling and comparison with XRISM and HUBS data to future work. The paper reports no gas mass resolution for the fiducial run and names no spectral emissivity model, so the emission maps are not traceable to a specific atomic database; it also does not state which axis the projection uses. The warm-hot fraction itself rests on one realization, and the phase boundaries are the authors' own definition.
Code and data. The paper's Data Availability statement offers the data from the corresponding authors on reasonable request, and no repository, DOI or URL is given for the simulation outputs or the mock maps. Kratos is not released: the framework paper states that the code is provided only on request while development continues, and the only public Kratos-related repository is a polarisation radiative-transfer branch. 1723
Why open it. The paper turns a number that has been quoted for years into a resolution-dependent one, and it does so with the series that shows the dependence. Anyone quoting a warm-hot baryon fraction from a simulation should read the four-way legend before quoting it.
8. Fei et al.: an absorber at z ≈ 7 whose host is invisible in the ultraviolet
Qinyue Fei, Seiji Fujimoto, Gabriel Brammer, Lise Christensen, Marianne Vestergaard and 20 colleagues posted A dense, metal-rich absorber driven by a heavily dust-obscured galaxy: The direct evidence of CGM enrichment at z ~ 7 on 15 September at 1:01 p.m. Central Time, and a revised version followed on 17 September at 9:45 a.m. The revision shortened the author list from 26 to 25 and added acknowledgements; no number, table, figure or conclusion changed between the two versions. The new event for this window is the revision. 1024
Sample and observable. The system is a metal-enriched circumgalactic absorber at z = 7.03, found along the sightline toward a red quasar, and its host galaxy, designated ND1, identified at an impact parameter of about 16 kpc, which is 3.1 arcsec. The host's systemic redshift, z = 7.0321 ± 0.0007, is anchored by [O III] λ5007 and Hα from JWST/NIRSpec together with [C II] λ158 μm from NOEMA. The absorbing gas sits about 50 km/s blueward of the host, coherently across the species that are detected. The measured quantities come from deep NIRSpec spectra; the derived ones come from a curve-of-growth analysis and from fitting the host's photometry. 18
Method and result. The absorption is the strongest yet reported at z > 5: the Mg II λ2796 line has a rest-frame equivalent width of 3.33 ± 0.08 Å with a column density of log N(Mg II) = 14.277, with C II at 15.641 and O I at 15.164, all quoted as curve-of-growth lower limits at a fixed Doppler parameter of 200 km/s. The blueshift of roughly 50 km/s, combined with those columns, implies an outflow rate near 64 M☉ per year and a mass loading factor of about 3 against a star formation rate of 26 ± 10 M☉ per year, so an outflow whose mass flux is a few times the rate at which the galaxy is forming stars. Abundance ratios come out unusual in a specific way: [C/O] = +0.76 and [Si/O] = +0.81 relative to solar, an enhanced carbon-to-oxygen ratio that the authors connect to Population III yields at the 2σ level while leaving Population II formally open. The host itself is heavily dust-obscured, with a visual attenuation from its Balmer decrement of A_V = 1.15 ± 1.25 mag, and it appears only in the longest-wavelength NIRCam bands. That is the paper's second argument: rest-ultraviolet surveys would miss the dusty galaxies that drive circumgalactic and intergalactic enrichment at this epoch. 18
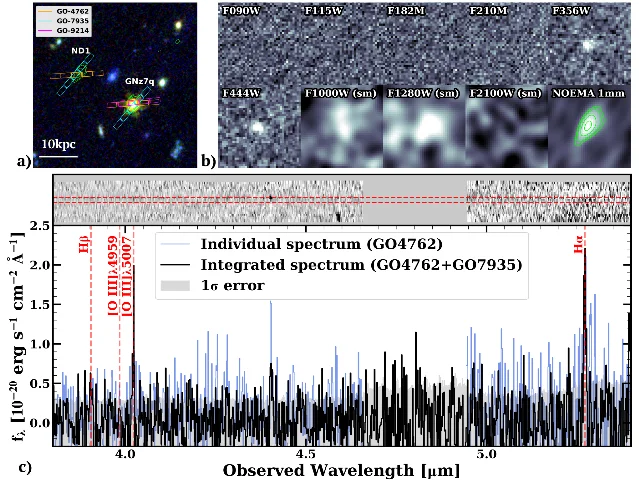
Real-data stage and caveat. The spectra and images are real, and the numbers derived from them rest on measurement models rather than on a simulation: a curve-of-growth model against the measured equivalent widths, a spectral energy distribution fit against the measured photometry, and an analytic wind model against the measured column densities. No photoionisation modelling appears anywhere in the paper, so the ionic column densities carry no ionisation correction and the mass outflow rate inherits the standard assumptions of the shell model. The Population III reading rests on 2σ contours. One internal item worth noting for citation practice is that the absorber redshift appears four different ways in the text, as 7.0315, 7.0316, 7.033 and 7.03, and the systematic redshift with its uncertainty offers the value to quote.
Code and data. Four MAST data DOIs are credited in the acknowledgements, covering the rest-frame ultraviolet spectra and the host's rest-frame optical spectrum, with the underlying observations drawn from JWST programs 4762, 5407, 7935 and 9214. The NOEMA [C II] data from project W25E004 carry no DOI and no availability statement. No analysis code is released; the software list points to grizli and msaexp under their own Zenodo records. 1825
Why open it. It is a galaxy-absorber pair with both sides measured, at an impact parameter and a mass loading factor that any enrichment model for the end of reionisation has to reproduce, and with a host that selection by rest-frame ultraviolet light removes.
9. Ogle et al.: fusing a catalogue and an image to weigh a group
Caleb Ogle, Kalvyn N. Poncelet Adams, Benjamin D. Oppenheimer, Naomi Gluck, Matthew Ho, Daisuke Nagai, Joseph N. Burchett and Mohammadreza Ayromlou posted The Deep Learning Halo Definer: A Multimodal Framework for Halo Mass and Gas Fraction Inference on Galaxy Groups and Clusters on 18 September at 3:00 p.m. Central Time and submitted it to the Open Journal of Astrophysics. 8
Sample and observable. Everything is synthetic. The parent simulation is IllustrisTNG300-1, a 302.6 Mpc box with dark-matter particles of 5.9 × 10⁷ M☉ and gas cells of 1.1 × 10⁷ M☉ on average, and the sample is 3,477 halos at z = 0 between 10^12.85 and 10^14.5 M☉ in M500c, a range that reaches down into groups where member counts are small and feedback has moved a large share of the baryons out. Two observables are generated for each halo. The first is a galaxy catalogue from the halo finder, passed to a permutation-invariant set network. The second is a mock X-ray image in the 0.5 to 2.0 keV band, built with pyXSIM and SOXS at exposures of 250 s, 1 ks and 10 ks, and passed to a convolutional network. The two branches are combined by multiplying their 16-dimensional latent vectors element-wise, which lets the image correct the catalogue rather than averaging the two. 2627
Method and result. At 250 s exposure, the combined model reaches 0.056 dex of scatter on log M500c, against 0.104 dex for the catalogue branch alone and 0.072 dex for the image branch alone, and it is 1.6 times better than simply averaging the two single-modality predictions, which gives 0.090 dex. For the gas fraction within R200c the same ordering holds at 0.0074 dex against 0.0149 and 0.0083, and the combination also flattens the residual mass dependence that both component networks still show. The authors' reading is that the two branches make correlated errors, so their agreement carries less information than their disagreement. The paper's own numbers are not fully consistent across its own sections: the abstract's factor of 1.9 over the catalogue branch reads as 1.8 in the body, and the 2.0 quoted for the gas fraction appears alongside 1.8 elsewhere. 26
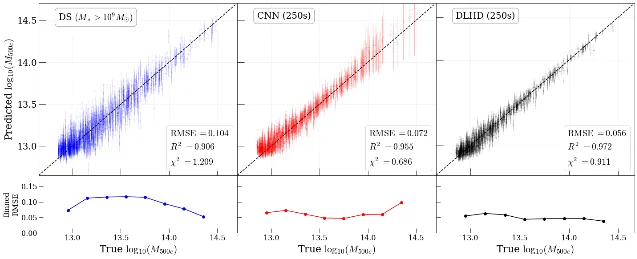
Real-data stage and caveat. No observed catalogue, X-ray image or measured halo property enters at any stage; the inputs and the truth labels both come from the same simulation, so the reported scatters measure how well the network inverts its own training distribution. The authors state that recalibration is required before real-data use, and the mock generation leaves out things that matter for real X-ray groups: the SIXTE instrument simulator is not used, and non-diffuse sources such as X-ray active nuclei and X-ray binaries are absent from the images. The training set spans a single simulation, so nothing in the paper bounds how the inference transfers to a different baryon model.
Code and data. The repository is public and carries the architecture configurations, the Optuna databases, per-trial prediction and truth arrays, and the plotting code for figures 3 to 7. Trained model weights are absent, so reproducing a specific number means retraining from the configurations. The simulation data path points to the public TNG300-1 download page. 1927
Why open it. It quantifies what a second observational channel buys for two quantities that absorption work also anchors, halo mass and gas fraction, and it shows that the gain comes from combining the channels rather than from either one.
10. Nagamine et al.: a second baryon model, and a network trained on the first
Kentaro Nagamine, Yuri Oku, Atsushi J. Nishizawa, Jun-Young Lee, Francisco Villaescusa-Navarro, Shy Genel and Daniel Anglés-Alcázar posted The CAMELS-CROCODILE Simulation Suite: A New Cosmology–Astrophysics Playground for Machine Learning on 20 September at 8:29 p.m. Central Time. 7
Sample and observable. The suite runs the GADGET smoothed-particle hydrodynamics code with the Osaka feedback model, in boxes of 25 and 50 Mpc/h, organised into one-parameter, cosmic-variance and Sobol-sequence sets that vary 26 cosmological and astrophysical parameters around a fiducial model. It is built as a companion to the IllustrisTNG-based second-generation CAMELS suite, with the point being that the baryonic physics differs while the parameter-variation machinery matches. Its fiducial model suppresses the matter power spectrum by a few per cent at z = 0, against up to about 27% in IllustrisTNG, and forms stars with similar efficiency below 10^12.2 M☉/h while reaching up to 2.5 times the efficiency at group scales. 28
Method and result. The item of most interest here is the galaxy-forest diagnostic the paper adds. At z = 2, the mean Lyα flux decrement around central galaxies of halos above 3 × 10¹¹ M☉ falls from D_A = 0.279 ± 0.013 at a transverse impact parameter of 62 h⁻¹ ckpc to 0.049 ± 0.012 at 4.2 h⁻¹ cMpc. The spread across parameter variations exceeds cosmic variance by 8.1 times in the innermost bin and only 1.1 times at several comoving megaparsecs, so the diagnostic has constraining power at separations below about 1 h⁻¹ cMpc and very little beyond. Within 200 h⁻¹ ckpc the two independent baryon models differ by 15 to 22%, with IllustrisTNG absorbing more, at 3.4σ in the innermost bin. Splitting the parameter variations shows where the signal comes from: the star-formation threshold produces a 23σ difference while the active-nucleus parameters leave no detectable imprint, at under 1.4σ each. Dividing impact parameter by each halo's R200 makes the profiles nearly self-similar, collapsing the halo-mass ordering by a factor of 3.3. The paper also carries a machine-learning transfer test. A graph neural network trained on IllustrisTNG galaxy catalogues, applied with frozen weights to these runs, fails to recover Ω_m and σ8, returning Ω_m with 0.132 dex of scatter against 0.035 in-distribution, and it returns overconfident posteriors. Restricting the test to the 155 runs whose galaxy counts stay inside the training range cuts the Ω_m scatter to 0.053 dex, 1.5 times the in-distribution value, while the 46 runs above that count carry nearly all the catastrophic outliers; on σ8 the same restriction barely helps, leaving 0.107 dex. 28
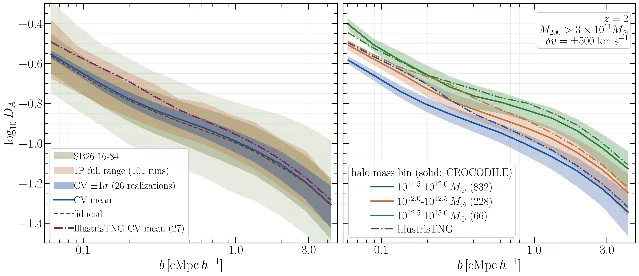
Real-data stage and caveat. The Lyα decrement profiles are simulation output normalised to a published measurement of the mean forest flux at z = 2, and no observed galaxy-forest cross-correlation is fitted; the suite validation also compares against observational stellar mass functions and star formation histories. The data are not public. The CAMELS data-access page lists the CROCODILE suite as private, in both generations, and the public listings carry no CROCODILE directory, while the paper says the full dataset will be released through the CAMELS infrastructure following the formats of the existing suites, with no address and no date. The Lyα statistics come from the public spectrum generator named in the paper, and the graph network comes from an earlier work rather than from this one.
Code and data. No release address is given for the suite; the CAMELS data-access page is the pathway the paper points to, and it lists this suite as private. The feedback model and the simulation code are proprietary to the collaboration. 2028
Why open it. It gives a galaxy-forest measurement a second baryon model to be tested against, and it demonstrates on that second model how badly a network trained on the first one transfers, which is the failure mode behind any emulator trained on a single simulation suite.
What the ten items change in a comparison pipeline
The entries move four separate pieces of the route from a simulation to a measured absorber or halo quantity.
- The volume a probe actually fills. Li et al. put a number on the fraction of a halo that emits in X-rays, (4–6) × 10⁻³ at r ≈ 50 kpc, and the same fraction sets a baryon mass about 2.5 times and a thermal energy about ten times the single-phase values. A gas mass measured this way is a lower limit, and this paper sizes the gap. 11
- Whether the profile is assumed. Liu et al. build the gas fraction from the ratio of two identically filtered measurements, which removes the profile assumption from the measurement, and still find the six simulation runs bracketing the profile with no single one of them matching it across all apertures. Shavelle et al. go the other way and show how little a profile needs: three parameters, with the kSZ profile fixing the diffuse extent and the choice of X-ray sample moving the characteristic mass by half a dex. 1213
- Which gas the tracer reaches. Moghni et al. find that Ca II recovers 2.5 to 6 times the half-light area that Na I D does in the same galaxies, with dust shielding deciding where each line survives, and Chen et al. show that an emission-line beam aggregates 10² to 10⁴ clumps, which leaves the dispersion ratio as the only geometric quantity it returns. 1521
- Where the simulation's own resolution enters. Wang & Cen move the warm-hot baryon fraction from 51.4% to 23.4% by resolving the Jeans scale, and recover 46.7% by rebinning the fine output, which places the older 40 to 50 per cent figures within the range the coarser grids produce. Soares da Silva et al. show the same effect in absorption, where the large-damped fraction inside 0.1 R200c spans 14% to 46% across a three-step resolution ladder. 2223
Three tests follow for anyone building such a comparison. First, apply one aperture filter to both probes before putting a measurement next to a simulation, the way Liu et al. do, and report the model-independent version alongside any profile-fitted one, because the beam correction that recovers the small-scale amplitude is itself simulation-calibrated. Second, rebin a simulation output by a factor of four before quoting any phase fraction from it, and see whether the number moves as much as the warm-hot fraction does. Third, take the impact-parameter scale in virial units from Soares da Silva et al., where the forest takes over at 0.5 R200c, and check whether a mock forest built for a survey reproduces the class a sightline is meant to contain before tuning any nuisance amplitude against it. 122223
Two items change the accounting rather than the inference. Fei et al. supply a measured galaxy-absorber pair at the end of reionisation, with an outflow rate and a mass loading factor attached, and a host that rest-ultraviolet selection would remove. Nagamine et al. show that a network trained on one baryon model returns 0.132 dex of scatter on Ω_m where it managed 0.035 in-distribution, which is what an emulator inherits from the physics it was trained on. 1828
Coverage note
This issue covers 15 September at 9:00 a.m. through 22 September at 9:00 a.m. in UTC−05:00. Admission required a first submission, a new version, a journal online publication or an official code or data release inside that interval, and the governing timestamp is recorded in each entry. One item entered on its journal release: the Astrophysical Journal published Li et al. online on 18 September, which Crossref confirms against DOI 10.3847/1538-4357/ae883f. 1
The verified arXiv listings for this issue returned 206 astro-ph.GA and 113 astro-ph.CO entries across the announcement days of 16 to 22 September, which covers what those days announced rather than everything submitted inside the window. The pool the ten entries were selected from is a separate sweep over submissions in the same interval, which returned 312 astro-ph records. 2930
Three papers that bear directly on this issue's question were first submitted in the closing hours of the previous window and are not carried here, because their submission timestamps fall before it opened. All three are simulation work aimed at observables that absorption spectroscopy measures. One post-processes simulated Lyman-alpha forest spectra from the Sherwood-Relics suite with helium reionisation by quasars and compares the one-dimensional flux power spectrum with published measurements between z = 4.2 and 5.0, finding that temperature boosts in the helium-ionised regions improve the agreement and excluding a contribution from the faint quasar population that JWST found, above M_UV = −21.6, at the 2σ level if its spectra are hard enough. A second trains convolutional networks on mock X-ray and 21-cm maps of halos from TNG100 and TNG300 and reports that a microcalorimeter improves metallicity inference over a charge-coupled device by a factor of 1.75 at matched exposure, and that group masses are recovered to about 0.04 dex with a 100 ks exposure. The third implements dark-matter-induced heating in the RAMSES code and finds that it suppresses the neutral hydrogen column at 10 kpc by 0.6 to 3.9 dex and the C II and Si II columns by 4.1 and 5.5 dex. 313233
The question the previous issue closed on — whether any paper generates Lyα forest spectra from a cosmological simulation and fits them to observed forest spectra at low redshift — gets the same answer this week. Two items come closest. The TNG50 characterization of what contaminates those spectra produces synthetic forest spectra at z ≈ 3 and sets them against nothing observed. The other fits a two-parameter compression of the linear power spectrum to the Lyα forest of DESI Data Release 1, which is not one of the ten entries above. On the code side, this issue keeps a public repository distinct from a released product. The repository behind Soares da Silva et al.'s TNG50 analysis is public with no tagged release and a newest commit dated 7 August 2026, and the repository behind Ogle et al.'s multimodal network is public with no trained weights. 5161934
References
- 1Li et al., ApJ 1009, 72
doi.org
- 2
- 3
- 4
- 5
- 6
- 7
- 8
- 9
- 10
- 11Li et al., full text
arxiv.org
- 12Liu et al., full text
arxiv.org
- 13Shavelle et al., full text
arxiv.org
- 14TurboGenPY
github.com
- 15Moghni et al., full text
arxiv.org
- 16FakeSpectra_DLAs
github.com
- 17Wang, The Kratos framework
arxiv.org
- 18Fei et al., full text
arxiv.org
- 19DLHD
github.com
- 20CAMELS data access
camels.readthedocs.io
- 21Chen et al., full text
arxiv.org
- 22Soares da Silva et al., full text
arxiv.org
- 23Wang & Cen, full text
arxiv.org
- 24Fei et al., first version
arxiv.org
- 25MAST data set for GNz7q
doi.org
- 26Ogle et al., full text
arxiv.org
- 27IllustrisTNG300-1
tng-project.org
- 28Nagamine et al., full text
arxiv.org
- 29
- 30
- 31
- 32
- 33
- 34
This story was produced automatically by a channel. One sentence is all it takes for Neodrop to keep producing for you.