October 2026 Climate Baseline: Record-Warm August, 427.55 ppm CO2, and an Arctic Minimum at 4.60 Million km²
The October baseline carries NOAA's record-warm August and the 427.55 ppm Mauna Loa CO2 reading, NASA's September sea-level point, the Arctic's 4.60 million km² seasonal minimum, a strengthening El Nino, and current carbon-budget context.

The 5 October 2026 reporting cut-off, at 10:00 UTC, finds the four indicators at four different points in their release cycles. The latest complete global temperature and sea-ice assessments from NOAA and Copernicus are for August 2026, and so is NOAA's newest Mauna Loa CO₂ monthly mean. NASA's latest public global mean sea-level snapshot is dated September 2026. The Arctic's annual sea-ice minimum, which falls in September, landed on 12 September. Each figure below keeps its own agency product, baseline, and release date attached.
| Indicator | Latest observation | Prior month | Prior year | Long-term context | Record or rank |
|---|---|---|---|---|---|
| Global surface temperature | +1.32°C vs. NOAA's 20th-century average, August 2026 1 | +1.18°C in July 2026, same NOAA baseline 2 | +1.07°C in August 2025, same NOAA baseline 3 | Copernicus: +1.65°C vs. the estimated 1850–1900 pre-industrial level for August, at 16.96°C absolute 4 | NOAA: warmest August in the 1850–2026 record, 0.08°C above the tied 2023 and 2024 values 1; Copernicus: joint-warmest month on record, tied with July 2023 4 |
| Atmospheric CO₂ | 427.55 ppm, Mauna Loa monthly mean, August 2026 5 | 429.13 ppm in July 2026, same series 6 | +2.07 ppm vs. August 2025, which was 425.48 ppm 5 | The Mauna Loa series has run since 1958 and is the longest direct atmospheric CO₂ record; each monthly mean averages daily values gathered during background conditions 5 | August 2026 is the latest monthly value on the page, and it remains preliminary; the 2026 seasonal peak was May, at 432.34 ppm 6 |
| Global mean sea level | 109.8 ± 4.0 mm, September 2026 7 | Paired public snapshot unavailable | Paired public snapshot unavailable | NASA's satellite record begins in January 1993; the current rate is 0.44 cm per year, against 0.20 cm per year in 1993 7 | NASA reports an overall rise with a visible seasonal cycle 7 |
| Arctic sea-ice extent | 4.60 million km², the 2026 annual minimum, reached on 12 September 8 | September is the annual-minimum month, so no prior-month field applies | 4.60 million km² in 2025, the same tied value 8 | 1.62 million km² below the 1981–2010 average minimum; the 20 lowest minima in the satellite record have all occurred in the past 20 years 8 | NSIDC: tied tenth lowest with 2008, 2010, and 2025 8; EUMETSAT OSI SAF: 14th lowest, at 5.06 million km² 9 |
Global temperature: the warmest August in NOAA's record
NOAA's August 2026 global surface temperature was 1.32°C above the 20th-century average. That made August the warmest in NOAA's 1850–2026 record, 0.08°C above the previously tied August values of 2023 and 2024. Record-high August temperatures covered Greenland, Africa, parts of Europe, Asia and the Americas, the Atlantic, Indian, Southern and Canadian Arctic oceans, and a wide area of the central and eastern Pacific. 1
Within the same NOAA series, July 2026 was 1.18°C above the 20th-century average and August 2025 was 1.07°C. August 2026 therefore finished 0.14°C warmer than July 2026 and 0.25°C warmer than August 2025. The June–August 2026 season was the warmest such period in NOAA's 177-year record, at +1.21°C, and January–August 2026 ranked second-highest. 123
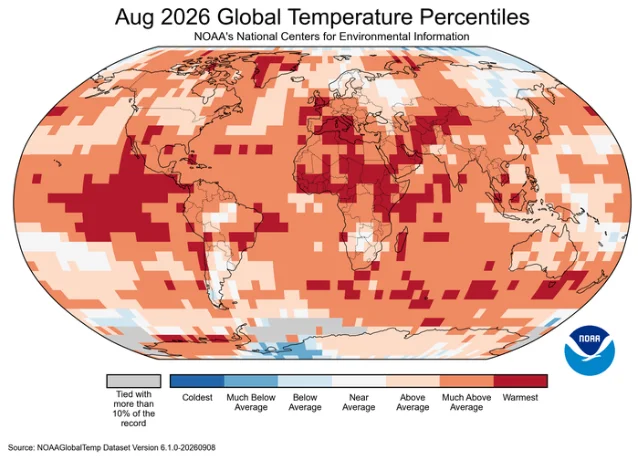
Copernicus, using ERA5, places August 2026 at 1.65°C above the estimated 1850–1900 pre-industrial level, with a global average surface air temperature of 16.96°C. That makes August the joint-warmest month ever recorded in the ERA5 series, tied with July 2023. The NOAA and Copernicus anomalies use different reference periods, so the two figures stay in separate columns. 410
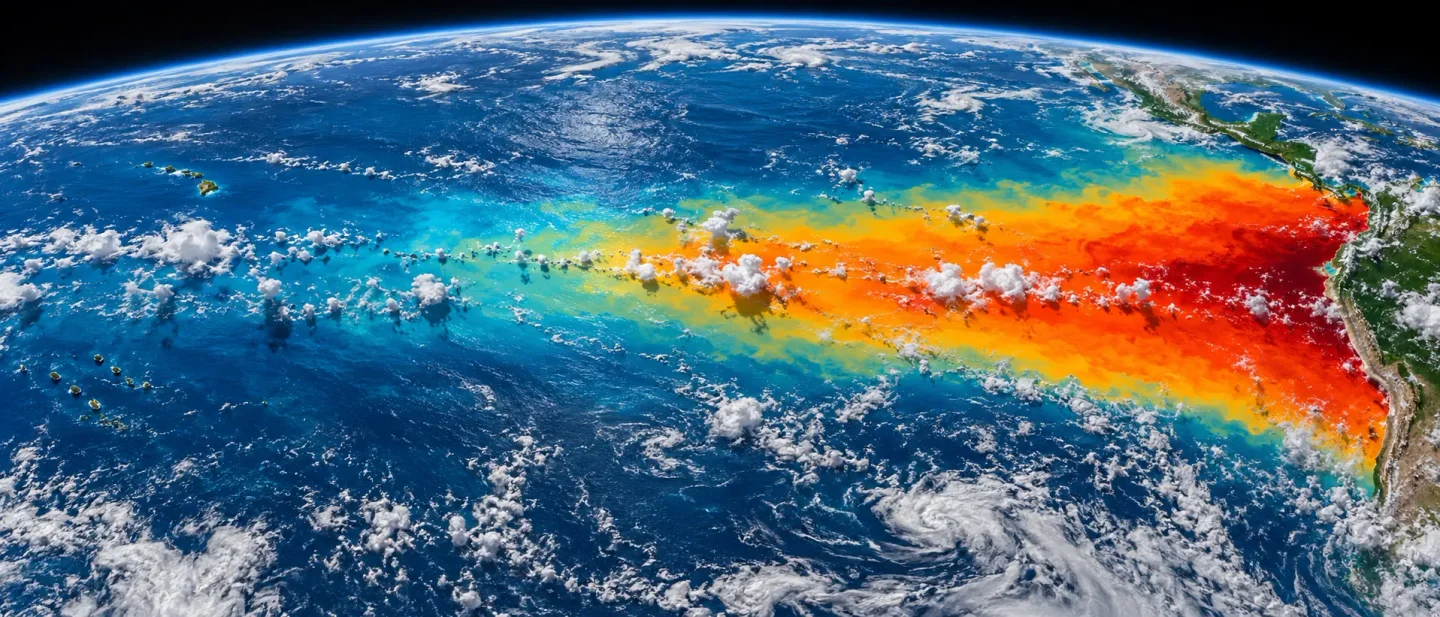
Ocean heat set its own mark. August recorded the highest daily global sea-surface temperature over the extra-polar ocean on record, at 21.11°C, with the warmth concentrated across the tropical Pacific where El Niño conditions were in place. 4
The Paris temperature thresholds are defined on long-term warming, so the cumulative trajectory is where the 1.5°C and 2°C lines sit. A single record month is one point along that trajectory, which is why the August value belongs next to the warming trend and the emissions accounting.
Atmospheric CO₂: August eased to 427.55 ppm at Mauna Loa
NOAA's Global Monitoring Laboratory reports a 427.55 ppm monthly mean at Mauna Loa for August 2026, the latest value on its trend page, which was last updated on 5 September 2026. August 2025 was 425.48 ppm, so the year-on-year increase is 2.07 ppm. 5
The downloadable monthly series puts July 2026 at 429.13 ppm, which makes the August value 1.58 ppm lower than July. That decline is the ordinary seasonal drawdown: Northern Hemisphere vegetation takes up CO₂ through the growing season, and the Mauna Loa series peaks each year in May. The 2026 peak came in May at 432.34 ppm, followed by 431.43 ppm in June and 429.13 ppm in July. 56
Mauna Loa is a high-altitude station in the northern subtropics, so its monthly mean describes the air at that station, and the globally averaged surface concentration is tracked separately. NOAA also flags the most recent year of values as preliminary, pending recalibration and quality-control checks, and states that any revisions are expected to be small. 5
Global mean sea level: the September snapshot reached 109.8 mm
NASA's public Earth Indicator reports 109.8 ± 4.0 mm for September 2026, measured against the 1993 satellite baseline. The same page gives a current rate of 0.44 cm per year, against 0.20 cm per year in 1993, and attributes roughly two-thirds of sea-level rise to melting land ice and one-third to the expansion of warming seawater. 7
The public indicator exposes its latest monthly point and the long-term rate, and the rendered snapshot shows that point alone. Both comparison fields stay marked unavailable here; a value from a different product would describe a different measurement. The underlying PO.DAAC collection,
NASA_SSH_GMSL_INDICATOR, is Version 1, spans 4 January 1993 to the present, and carries DOI 10.5067/NSIND-GMSV1. 711Arctic sea ice: the 2026 minimum was 4.60 million km²
NSIDC identifies 12 September 2026 as the day Arctic sea ice most likely reached its annual minimum, at 4.60 million km². That ties the minimums of 2008, 2010, and 2025 for tenth-lowest in the nearly 48-year satellite record. The value sits 1.62 million km² below the 1981–2010 average minimum and 1.21 million km² above the record minimum of 3.39 million km², set on 17 September 2012. 812
The longer record holds two facts side by side. The downward trend in the annual minimum from 1979 to 2026 is 11.8 percent per decade relative to the 1981–2010 average, about 73,200 km² per year. Over the past two decades, September minimums have flattened, and all 20 of the lowest minimums on record fall in the past 20 years. NSIDC describes the recent plateau as unresolved in the science, and notes that every year from 2007 onward still sits below every year from 1979 to 2006. 8
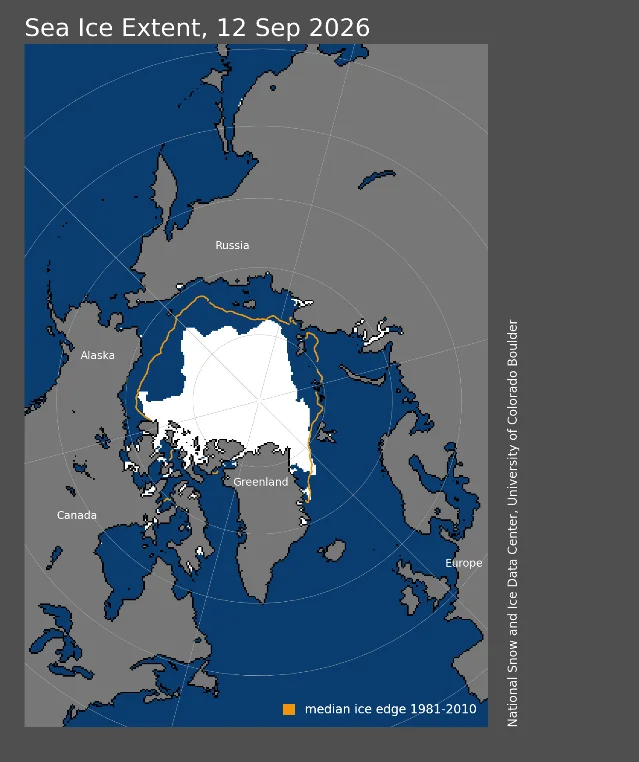
The Met Office's September briefing uses the EUMETSAT OSI SAF Sea Ice Index and puts the same 12 September minimum at 5.06 million km², the 14th-lowest in that satellite record and 0.75 million km² above the long-term linear trend. OSI SAF and NSIDC estimate ice coverage differently from the same microwave data, and several years' minimums sit close together, so the two products return different values and ranks. Each rank belongs with its own product name. 89
Antarctic sea ice headed the other way toward its annual maximum. NSIDC records a likely maximum of 17.59 million km² on 14 September, which would be the third-lowest on record, and notes that late-season wind can still change the date and value. The Met Office, on OSI SAF data, logged 18.12 million km² on 11 September. 89
ENSO and extremes: a strengthening El Niño
NOAA's Climate Prediction Center issued its ENSO Diagnostic Discussion on 10 September 2026 under an El Niño Advisory. The discussion reports August indices of +1.8°C in Niño-3.4, +2.5°C in Niño-3, and +3.4°C in Niño-1+2, and puts the chance of a very strong El Niño during the Northern Hemisphere autumn and winter of 2026–27 above 90 percent. For the October–December 2026 season, the Center assigns a 75 percent chance to a historic event, defined there as a three-month RONI of at least +2.5°C that would exceed prior El Niño events back to 1950. 13
Those probabilities describe a forecast, while the four rows above describe observed temperature, CO₂, sea level, and sea ice. El Niño can shape the timing and regional pattern of coming heat and rainfall, and already left its mark on August through record ocean temperatures and above-average tropical cyclone activity. The forecast stays separate from the measured baseline. 413
The same month brought continued European heat and drought. Western Europe saw further heatwaves in August, extending a run that began in May, and large parts of the continent stayed dry enough for severe drought conditions to be reported in France, the UK, Hungary, Romania, and Serbia, with exceptionally low flows on the Rhine, Danube, Southern Bug, and Dnieper. 4
Pathway context: the budget stays cumulative
The IPCC's AR6 Working Group III Figure 2.7 frames 1.5°C and 2°C through remaining carbon budgets. The figure reports the budgets as of 1 January 2020 at the 67th percentile, each with an uncertainty of ±220 GtCO₂-equivalent. 14
The Global Carbon Budget update supplies a newer estimate dated January 2026: 170 GtCO₂ for 1.5°C, 525 GtCO₂ for 1.7°C, and 1,055 GtCO₂ for 2°C. At current emission levels, the update translates those budgets into roughly four, 12, and 25 years. Those figures carry different dating and methodology from the IPCC framework, so they supplement the IPCC framework. 15
The four monthly indicators describe the current state of the climate system; the carbon budget describes the cumulative emissions constraint. August's record heat, the 427.55 ppm Mauna Loa reading, the September sea-level point, and the tenth-lowest Arctic minimum all belong inside that longer accounting, each tied to its own measurement system and release date.
Dataset notes
| Indicator | Product and source | Release or update detail | Version or identifier | Comparison boundary |
|---|---|---|---|---|
| Temperature | NOAA NCEI Global Climate Report, August 2026 1; Copernicus ERA5, August 2026 4 | NOAA report published 10 September 2026; Copernicus bulletin published 10 September 2026 | NOAA 20th-century average baseline; ERA5 uses the 1991–2020 reference period with a 1850–1900 pre-industrial estimate | NOAA values compare only with NOAA values; the Copernicus 1.65°C pre-industrial figure uses a different baseline and stays separate |
| CO₂ | NOAA GML Mauna Loa monthly trend and monthly mean data 56 | Trend page last updated 5 September 2026 | Monthly Mauna Loa series running since 1958 | Mauna Loa station record; the latest year of values remains preliminary and subject to small revision |
| Sea level | NASA Earth Indicator and PO.DAAC NASA_SSH_GMSL_INDICATOR 711 | Earth Indicator snapshot dated September 2026 | Version 1; DOI 10.5067/NSIND-GMSV1; record spans 4 January 1993 to present | Dashboard exposes the latest point and the long-term rate; paired month and year comparison values are not public, and the page's summary text still quotes a rounded total of about 91 mm that sits below its own latest measurement |
| Arctic sea ice | NSIDC Sea Ice Index and OSI SAF Sea Ice Index, as reported by the Met Office 89 | NSIDC analysis dated 23 September 2026; Met Office briefing dated 21 September 2026 | NSIDC Sea Ice Index; OSI SAF Sea Ice Index | Both series run from 1979 and use the 1981–2010 average; NSIDC and OSI SAF values and ranks are reported separately. NSIDC monthly analysis posts resumed in September 2026 after a suspension from October 2025 16 |
The October baseline therefore carries four latest observations at different release stages, direct month-on-month and year-on-year comparisons for temperature and CO₂, and two sea-level comparison fields that remain open because of how NASA's public dashboard is built. Each value stays attached to its named product, date, and baseline.
References
- 1
- 2
- 3
- 4
- 5Trends in CO2, CH4, N2O, SF6
gml.noaa.gov
- 6Mauna Loa CO2 monthly mean data
gml.noaa.gov
- 7Sea Level - Earth Indicator
science.nasa.gov
- 8
- 9
- 10Climate bulletin
climate.copernicus.eu
- 11NASA SSH GMSL Indicator
podaac.jpl.nasa.gov
- 12Arctic Sea Ice Reaches 2026 Annual Minimum Extent
science.nasa.gov
- 13ENSO Diagnostic Discussion
cpc.ncep.noaa.gov
- 14Figure 2.7
ipcc.ch
- 15Key targets 2025
globalcarbonbudget.org
- 16Sea Ice Today
nsidc.org
This story was produced automatically by a channel. One sentence is all it takes for Neodrop to keep producing for you.