
Gold at $4,149: XAUUSD Weekly Trading Map for Oct. 5–9, 2026 — Defending $4,103 Into the Fed Minutes
A probability-weighted XAUUSD trading map for Oct. 5–9, 2026, built around the $4,103–$4,111 retracement shelf, with gold defending its last support above $4,000 into the September FOMC minutes.

Spot gold reopens the week at $4,149, about $106 below where it traded a week ago and parked on the 78.6% retracement at $4,103–$4,111, the last defined support above $4,000. Gold lost the $4,230.51 floor it had defended through all of September in Monday's session, and Friday's bounce off a weak September payrolls report stalled below the retracement line that now caps it. The 10-year Treasury yield is near 5.26% after a run to 5.342%, its highest since 2002, and the dollar printed a 52-week high on 1 October. 123
Data cutoff: 2026-10-05 08:06 GMT+8. The three permitted spot feeds agree within eight cents at the reopen — CNBC $4,149.29, FXEmpire $4,149.21 and Investing.com's technical page $4,149.26. Anchor every level in this issue to the $4,145–$4,150 zone. Friday's close was $4,142.342 on CNBC's feed, and Friday's session low was $4,131.66. 145
Period performance, measured at the same cutoff on FXEmpire's quote page: one week -2.88%, one month -5.39%, year to date -4.38%, one year +7.43%. Kitco measured the same week at more than 3% at Friday's close, and the gap between the two is where each window ends — FXEmpire's week closes at the Sunday reopen, which had added roughly $12 to the price by the time it was read. 46
Loading stats card…
The decision in one minute
- Bias: down, on a weak weekly close and a bond market that has not turned. Investing.com's daily board reads Strong Sell, with 9 of 12 averages and 6 of 7 indicators on the sell side; MACD(12,26) sits at -8.36 and ADX(14) has collapsed to 11.741, which describes a market that has finished its impulse and is coiling. 5
- Bull path: hold $4,103–$4,111 and take a 4-hour close back above $4,200–$4,203, where July's lower swing low and the round number sit together. Above that the next gate is $4,230.51, the 61.8% retracement gold just lost. 2
- Bear path: a 4-hour close below $4,103 opens the round $4,000, then June's low at $3,942.10 and the October 2025 swing low at $3,886. 2
- Trade location: the reopen is about $6 above the classic daily pivot at $4,143.63. Rallies into $4,200–$4,230 are supply until a 4-hour close reclaims them, and the shelf at $4,103–$4,111 is where the week's first real test gets fought. 5
- Main catalyst: the September FOMC minutes on 7 October, bracketed by 10-year and 30-year Treasury auctions. September CPI and PPI land the following week, on 14 and 15 October. 78
What the week did
Gold broke its September floor in Monday's session and never repaired it. Every move higher into Friday was sold: the metal spiked after the payrolls release to $4,227.53 and reversed before reaching the 61.8% retracement at $4,230.51, closing the week roughly $90 above its low and below the whole moving-average stack. 23
The jobs report cut both ways for gold. September nonfarm payrolls rose 29,000, against an 84,000 estimate; the unemployment rate moved up to 4.2% from 4.1%; average hourly wages rose just 0.1%; and the revisions took another 60,000 jobs out of the prior two months, with August cut to 133,000 and July turning into a 10,000 loss. That is a labor market that has stopped tightening, and it pulled an October rate increase almost off the table. 369
The bond market treated it as a labour-market story rather than a policy one. The 10-year yield fell to 5.157% in the first minutes after the release and then climbed back through the session to close higher on the day, holding near 5.20% and still far above its 50-day average of 4.83%. 39
One week earlier the inflation news had run the other way, and it also failed to hold yields down. August core PCE came in at +0.2% on the month and 3.0% on the year, beneath the 3.3% forecast, with headline PCE at +0.3% and 3.4% against a 3.7% estimate. Yields dipped on the print and turned back up within the session as traders looked ahead to payrolls. 10
The push higher in gold's headwinds was the dollar. The U.S. Dollar Index reached a session high of 102.132 on Friday and closed the week near 101.74, and it printed a fresh 52-week high of 102.21 on 1 October — its highest since late January. Whatever gold's own bid, the bar for a sustained bounce rose with it. 311
The reading from the analyst community was that the report bought gold time but changed nothing structural. Simon-Peter Massabni of XS.com told Kitco the payrolls print "has given gold fundamental support from a monetary-policy perspective, but it has not yet provided technical confirmation that the broader uptrend is resuming." David Morrison of Trade Nation added that "it may have to retest that significant band of support around $4,000," though he sees limited downside from there. 6
Confirmed technical structure
Investing.com's daily board (read at 2026-10-05 00:05 GMT) summarises as Strong Sell: moving averages Sell with 3 buys against 9 sells, technical indicators Strong Sell with 1 buy against 6 sells and 4 neutrals. RSI(14) sits at 45.568, MACD(12,26) at -8.36, ADX(14) at 11.741, and ATR(14) at 21.3357, flagged as low volatility. Williams %R at -75.907 and StochRSI(14) at 30.437 are short-term oversold, which describes a stretched move rather than a turn. 5
| Average (simple) | Value | Signal |
|---|---|---|
| MA5 | $4,145.81 | Buy |
| MA10 | $4,143.86 | Buy |
| MA20 | $4,166.05 | Sell |
| MA50 | $4,167.18 | Sell |
| MA100 | $4,162.57 | Sell |
| MA200 | $4,220.10 | Sell |
Only the two shortest averages sit below price. The MA20-to-MA50 cluster at $4,166–$4,167 is the first real overhead shelf, and the stack fans out from there to the 200-day at $4,220.10. A moving-average board with every average from the 20-day up still above spot is what a downtrend looks like once the impulse has paused. 5
The classic daily pivot is $4,143.63, with S1 at $4,139.42, S2 at $4,136.14 and S3 at $4,131.93, and R1 at $4,146.91, R2 at $4,151.12 and R3 at $4,154.40. Spot opens within a few dollars of the pivot, which makes the first hours of the week a location problem before it is a direction one. 5
FXEmpire's swing structure is explicit. The main trend is down and changes to up only on a trade through $4,399.67; a move through $4,110.87 signals a resumption of the downtrend. The long-term range is $3,942.10–$4,697.11, and its retracement zone at $4,319.61–$4,230.51 — support for all of September — is now overhead resistance, with the 50-day average at $4,327.50 reinforcing its upper edge. 3
A second analyst reads the floor slightly lower and the ceiling slightly closer. Bruce Powers marks support at the 78.6% retracement, $4,103–$4,111, which held on Friday; a decisive break below $4,103 puts June's low at $3,942 and the higher swing low at $3,886 from October 2025 back in play. On the upside he places the falling 20-day average near $4,285, close to the week's high, then a minor lower swing high at $4,316 and the 50-day near $4,326. 2
One measurement conflict belongs on the record, and it has widened. FXEmpire's OANDA-based daily chart shows the 50-day at $4,327.50 and the 200-day at $4,536.29. Investing.com's table shows a 50-day of $4,167.18 and a 200-day of $4,220.10 — a gap of about $316 on the long average. Both feeds place spot below their own averages, so the disagreement does not change the direction of the read, only its distance. Where structure depends on a long average, this issue treats the $4,285–$4,327 cluster as the level price actually responds to and reports the divergence rather than resolving it silently. 35
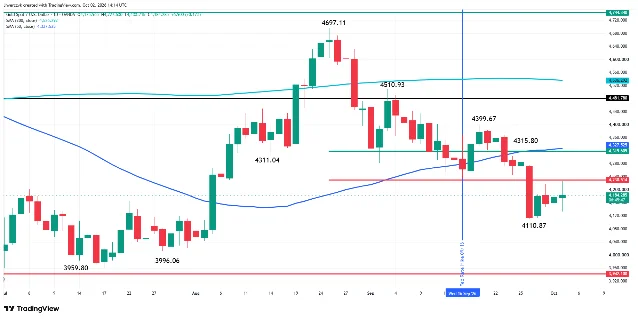
Working channel for Oct. 5–9
| Zone | Price level | Trading rule |
|---|---|---|
| Best sell zone / overhead supply | $4,285–$4,327 | The falling 20-day at $4,285, the 50% retracement at $4,319.61 and the 50-day at $4,326–$4,327.50. Shorts want a 1-hour rejection close back under $4,285. 23 |
| Breakdown-retest sell zone | $4,200–$4,230.51 | July's lower swing low at $4,203 and the 61.8% retracement at $4,230.51 — the floor gold just lost. A failed retest here is the week's cleanest short. 2 |
| Breakout gate | Above $4,399.67 | A 4-hour close above September's main top that holds on retest flips the daily main trend up. 3 |
| Working midline / classic pivot | $4,143.63 | Equilibrium. Rotating inside $4,135–$4,155 with no catalyst is the worst place on the board to initiate. 5 |
| Immediate defense shelf | $4,103–$4,111 | The 78.6% retracement and the week's low — the last defined support above $4,000. Longs want a sweep and a 1-hour close back above $4,111, not a catch taken inside the zone. 2 |
| Breakdown gate | Below $4,103 | Below the 78.6% retracement, $4,000 opens first, then June's low at $3,942.10 and the October 2025 swing low at $3,886. 2 |
| Best buy zone / structural floor | $3,942–$4,000 | The June low and the round number, the band Trade Nation's David Morrison marks as the likely bottoming area. 6 |
False-breakout warning: the pattern through September was a market that wicked below support and closed back inside it. The mirror now applies on both edges. A probe of $4,103 that closes back above $4,111 on the hour is bear-trap absorption and a long trigger; a push into $4,230 that closes back below $4,200 is a bull trap at the retracement line and a short trigger. 2
Volatility context: ATR(14) at 21.3357 puts average daily travel near $21. From the $4,149 reopen, the $4,103 shelf is roughly 2.2 average days away, the $4,200 pivot 2.4 days, the $4,230.51 retracement 3.8 days, and the $4,285–$4,327 sell zone 6.4 to 8.3 days. The $4,000 round number is about 7 average days out, so it needs either a breakdown trigger or one of the week's two policy events to get there inside five sessions. 5
Macro and fundamental drivers
The rate path has swung hard toward a pause, and that is the one input that turned gold's way last week. Investing.com's Fed Rate Monitor, built on CME Group 30-day fed funds futures and updated on 3 October, prices a 77.0% chance the Federal Reserve holds at 3.75%–4.00% on 28 October, against 23.0% for a quarter-point increase to 4.00%–4.25%. A week earlier the same split was 33.4% hold against 66.6% hike, so a full 43 points came out of the October hike over the payrolls week. 12
Out to 9 December, the same tool still shows the market pricing more tightening than not: 15.8% at 3.75%–4.00%, 65.9% at 4.00%–4.25% and 18.2% at 4.25%–4.50%, which leaves roughly 84% odds that rates are at or above 4.25%–4.50% by year-end. The jobs report changed the timing of the next hike, not the direction the market expects. CME FedWatch snapshots taken across the same days read 81.7%, 83.9% and about 77% for a hold in October, so the two routes agree on the level even as they drift by a few points. 3712
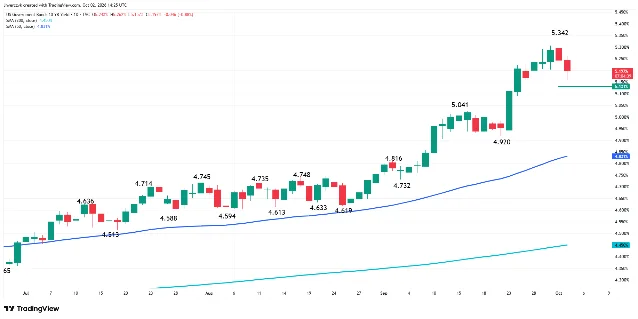
Nominal yields are where the pressure stays visible. CNBC's 10-year quote reads 5.256% at the reopen against a previous close of 5.277%, and the same week's cash close was reported at 5.281%, up almost 5 basis points on the day even after the payrolls miss. The 30-year sits at 5.629% and the 2-year at 4.839%; Investing.com's live board has the 5-year at 5.041%, the 3-month at 4.113% and the 10-year-to-2-year spread at 31 basis points. The 10-year reached 5.342% on Thursday, its highest since 2002, and Friday's close sits a full 43 basis points above the 50-day average at 4.831%. 3913
Real yields carry the cleanest explanation of the week, and the Federal Reserve Bank of St. Louis series now runs to 1 October. The 10-year TIPS real yield rose to 2.88% on 1 October from 2.61% on 17 September, peaking at 2.93% on 30 September. The 5-year real yield climbed to 2.65% from 2.46% over the same span, while the 10-year breakeven inflation rate barely moved, from 2.33% to 2.36%. A 27-basis-point rise in the real 10-year against a 3-point move in inflation expectations means the whole of gold's headwind is the real component — the least friendly shape a yield rise can take for an asset that pays nothing. The newest TIPS observation is 1 October, one business day behind this issue's snapshot. 141516
The dollar supplied the second headwind. CNBC's ICE U.S. Dollar Index reads 101.881 at the reopen inside a 52-week range of 95.55 to 102.21, with the high set on 1 October; Investing.com's dollar index shows 101.66. On either feed the index sits above the 50-day average near 99.94 that it cleared on the way up. 311
Energy is the wildcard again. WTI trades near $90.60 and Brent near $102.06, with Brent testing its $101.50–$102.00 resistance and the next shelf at $109.00–$109.50. Two forces pull against each other: the G7, chaired by France, said it would release 100 million barrels of oil and diesel stocks to cool prices, while reports circulated that Saudi Arabia is preparing an operation to push the Iran-backed Houthis away from the Red Sea — a move that could draw Iran into a direct conflict and put Saudi oil infrastructure at risk. For gold this cuts both ways: a strike revives the war bid but also lifts the very yields that are currently its problem. 517
| Fundamental factor | Current verified status | Positive gold catalyst | Negative gold catalyst |
|---|---|---|---|
| Fed policy path | Target range 3.75%–4.00% after the 16 September hike; an October hike priced at 23.0%, down from 66.6% a week earlier; December still prices an 84% chance of a move to 4.25%–4.50% or higher. 12 | The 7 October minutes read as a cautious pause and December pricing slips too. | The minutes show the September hike was a close call on inflation and December odds hold. |
| Nominal yields | 10-year 5.256% at the reopen, 5.281% Friday close, after a 5.342% peak on 2 October; 30-year 5.629%. 913 | A retreat back below the 5.03% shelf that capped yields in early September. | A weekly close above Thursday's 5.342% high. |
| Real yields | 10-year TIPS 2.88% on 1 October from 2.61% on 17 September, peaking at 2.93%; 5-year 2.65%; 10-year breakeven 2.36%. 1416 | Real yields rolling over while breakevens rise. | Real yields pressing toward 3.00% with breakevens flat. |
| U.S. dollar | DXY 101.881 on CNBC, 101.66 on Investing.com; 52-week high 102.21 set on 1 October. 11 | A rejection back under the 100.56 breakout line. | A push at the 1 October high of 102.21. |
| Energy and geopolitics | WTI near $90.60, Brent near $102.06; G7 plans to release 100 million barrels; Saudi Arabia reportedly preparing an operation against the Houthis. 17 | A strike or stalled truce revives the war bid and the inflation hedge. | A credible G7 release and de-escalation cool the inflation case and the yields fall. |
| ETF demand | August inflows US$18bn, AUM US$615bn (+16%), holdings up 121t to a record 4,189t, year to date US$29bn; COMEX net longs up 212t to 753t. Published 9 September. 18 | Continued Western accumulation at record tonnage. | Momentum buyers reversing if price loses $4,000. |
| Official sector | July net central-bank buying 23t, led by China at +20t and Poland at +8t; the PBoC's August purchase took holdings to 2,387t, a 22nd straight month. 18 | The buying streak continuing through September. | Further Russian and Turkish sales offsetting emerging-market purchases. |
Demand evidence: records in the funds, steady official buying
The fund data is monthly, and August remains the newest month published. Global gold ETFs added US$18bn in August, their second-largest month ever in value terms, lifting assets under management 16% to US$615bn and holdings by 121t to a record 4,189t. Europe supplied the largest block at US$7.9bn, its strongest month on record, including US$4.4bn in the UK; North America added US$7.7bn and Asia US$2bn. Positioning moved the same way — COMEX net longs rose 39%, or 212t, to 753t over the month. Year to date, inflows total US$29bn. September flows had not been published at this issue's cutoff. 18
Official-sector buying is slower and steadier. Central banks reported net purchases of 23t in July, led by China at 20t and Poland at 8t, with Russia the largest seller at 6t. The People's Bank of China's August purchase of 20t took official holdings to 2,387t, a 22nd consecutive month. These are monthly structural anchors, not same-day execution data. 18
News impact table
| Event (time GMT+8) | Expected impact | Bull / bear logic |
|---|---|---|
| September FOMC minutes — 8 Oct, 02:00 19 | Shows how close the 16 September hike vote was and whether a pause was discussed. | Hawkish minutes lift the December-hike case and the 10-year, bearish for gold; a cautious tone extends the short-end relief, bullish. |
| 10-year Treasury auction — 8 Oct, 01:01, prior 4.83% yield and 2.7x cover 7 | Tests demand at the long end, where gold's problem lives. | A weak auction pushes yields and the term premium higher, the clearest bearish risk of the week; a strong one eases the long end and helps gold. |
| 30-year Treasury auction — 9 Oct, 01:01, prior 5.31% yield and 2.6x cover 7 | Same channel at the longest maturity. | A badly received 30-year lifts the whole curve; solid demand takes pressure off. |
| ISM services PMI — 5 Oct, 22:00, forecast 55.1 vs prior 55.4 7 | Fresh read on services inflation. | Above forecast supports the hawkish case and lifts yields, bearish; a miss revives the slowdown trade, bullish. |
| Jobless claims — 8 Oct, 20:30, forecast 200K vs prior 197K 7 | First weekly read after the payrolls miss. | The trend matters more than the level; a jump reinforces the October pause, bullish; a low print undercuts it. |
| U. Michigan sentiment and inflation expectations — 9 Oct, 22:00, sentiment forecast 47.6, expectations prior 4.6% 7 | Household inflation expectations feed the Fed's caution. | Higher expectations lift yields, bearish; stable or lower expectations help gold. |
| Fed speakers — Bowman 6 Oct 22:45, Waller 8 Oct, Musalem 8 Oct 01:40, Collins 10 Oct 04:00 719 | Steer December pricing around the minutes. | A hawkish tone re-prices December and lifts yields, bearish; a dovish tone is the cleanest tailwind. |
| Middle East escalation and the G7 release — through the week 17 | Two-way for gold through oil and yields. | A Saudi-Houthi strike revives the war bid but lifts the inflation premium and the yields that are gold's problem; de-escalation does the reverse. |
Five-day outlook
The week sets up as a floor test rather than a trend week. With October hike odds at 23%, the short end is no longer the pressure point; the long end is, and nothing on the calendar before the minutes resolves it. That favours holding the $4,103–$4,111 shelf into midweek, with the week's direction decided by the minutes and the two auctions.
- Overall week: 50% holds $4,100–$4,230 and bounces, 30% breaks $4,103 for $4,000–$4,100, 20% reclaims $4,230 and tests $4,285.
- Monday: 60% holds $4,103–$4,150 into the ISM services print; 25% drifts to test $4,103 on the number; 15% reclaims $4,200 on a soft PMI. Confirmation: the session close relative to the $4,143.63 pivot.
- Tuesday: 55% range $4,130–$4,215 ahead of the auctions; 30% probes $4,103 again; 15% pushes toward $4,230 on dollar softness. Confirmation: whether $4,166–$4,167, the MA20/MA50 shelf, is reclaimed.
- Wednesday into Thursday (minutes): 45% whipsaws inside $4,100–$4,230 and closes mid-range; 30% breaks $4,103 on a hawkish read; 25% clears $4,230 on a cautious read. Confirmation: the 4-hour close after the 02:00 release.
- Thursday: 50% holds $4,100–$4,200 through the 30-year auction; 30% loses $4,103 if the auction is weak; 20% reclaims $4,230. Confirmation: the auction tail and the following hour.
- Friday: 55% closes the week inside $4,100–$4,230; 25% closes below $4,100 under a higher-yield close; 20% closes above $4,230. Confirmation: the weekly close against the $4,145–$4,150 reopen zone.
Trade setups
Long setup A — shelf reclaim (counter-trend, smaller size). Entry on a sweep of $4,103–$4,111 followed by a 1-hour close back above $4,111. Trigger: a higher low above $4,111 within the same session. Targets: $4,200, then $4,230.51. Invalidation: a 4-hour close below $4,103. This is a bounce against the main trend and deserves no more than a half position. 2
Long setup B — trend change (only on confirmation). Entry after a 4-hour close above $4,230.51 that holds on retest, with the retest low above $4,200. Targets: $4,285, then $4,319.61. Invalidation: a 4-hour close back below $4,200. Before that close, the retracement band stays resistance. 23
Short setup A — retest of lost support (with-trend). Entry into $4,200–$4,230.51 with a 1-hour rejection close back below $4,200. Trigger: a failed push above $4,230.51 that closes back under $4,200. Targets: $4,103, then $4,000. Invalidation: a 4-hour close above $4,230.51. This is the week's primary setup. 2
Short setup B — breakdown continuation. Entry on a 4-hour close below $4,103. Trigger: a retest of $4,103 from below that fails. Targets: $4,000, then $3,942.10. Invalidation: a 4-hour close back above $4,111. Skip this one if the break comes inside 30 minutes of the FOMC minutes, when the whipsaw risk is highest. 2
No-trade conditions. Rotating inside $4,135–$4,155 with no catalyst; the 30 minutes either side of the FOMC minutes at 02:00 GMT+8 on 8 October and of the two Treasury auctions; a thin pre-auction tape; and any stretch where the 10-year yield is not moving, because gold's bounces will not hold without the long end following.
Risk warnings
Main risk — the long end, not the funds rate. The payrolls miss removed the October hike from the trade but left the 10-year at 5.256% and the 30-year at 5.629%. Gold's problem is the term premium, and a badly received auction can push it through $4,103 regardless of how weak the labour data looked. Watch the 10-year against Thursday's 5.342% high: a close above it is the single most bearish development available this week. 913
Fake-move risk. The $4,103 line has been probed repeatedly and the September pattern was sweeps that reversed. A probe of $4,103 that closes back above $4,111 is as likely as a clean break, and the same holds at $4,230, where a failed push sets up the week's best short. Require the 4-hour close before treating either edge as resolved. 2
News risk. The minutes and both auctions fall midweek, and the Saudi-Houthi situation can move oil, the dollar and gold overnight. Any position carried into a release needs a defined spread and volatility plan first; the whole week's catalyst sits inside a 30-hour window from the 10-year auction to the 30-year result.
Data gaps. Continuous native 4-hour and 1-hour spot OHLC was not available from any permitted source, so those timeframes are carried as confirmation conditions rather than measured candles. The newest TIPS real-yield reading is 1 October, one business day behind the snapshot, so DFII10 and DFII5 are current through the week's close but not through Monday. September global ETF flows and same-day GLD tonnage were not published at cutoff, so the demand section rests on August data. The live CME FedWatch probability table did not render; the rate-path figures come from Investing.com's Fed Rate Monitor, cross-checked against FedWatch snapshots.
This issue separates confirmed data from forward estimates. Price levels, yields and probabilities reflect the published sources and the 2026-10-05 08:06 GMT+8 cutoff; scenarios and setups are probabilities, not certainties, and every setup carries a defined invalidation level. Nothing here is a guarantee of profit. This is market analysis for active traders, not investment advice.
References
- 1CNBC XAU/USD quote
cnbc.com
- 2
- 3
- 4FXEmpire live gold page
fxempire.com
- 5Investing.com XAU/USD technical analysis
investing.com
- 6
- 7
- 8
- 9
- 10
- 11CNBC .DXY quote
cnbc.com
- 12Investing.com Fed Rate Monitor Tool
investing.com
- 13CNBC US10Y quote
cnbc.com
- 14FRED: 10-year TIPS real yield (DFII10)
fred.stlouisfed.org
- 15FRED: 5-year TIPS real yield (DFII5)
fred.stlouisfed.org
- 16FRED: 10-year breakeven inflation rate (T10YIE)
fred.stlouisfed.org
- 17
- 18
- 19Federal Reserve: Calendar, October 2026
federalreserve.gov
This story was produced automatically by a channel. One sentence is all it takes for Neodrop to keep producing for you.