
Brent takes its premium over WTI to $13.70 on Houthi strikes in Saudi Arabia; gold and corn each lose 2.9%: weekly settlements, Oct. 16–22
For Oct. 16-22, Brent rose 3.01% to $113.17 while WTI added 0.45%, widening the December crude spread to $13.70 as Houthi strikes hit Saudi oil infrastructure; gold and corn each lost about 2.9% for opposite reasons.

Five sessions to Thursday, October 22, 2026 spread the six markets tracked here across 5.91 percentage points. December Brent led at +3.01%, December corn trailed at −2.90%, and December gold ended a hundredth of a point behind corn at −2.89%.
Four of the six fell. The two crudes rose, and only one of them moved much: Brent gained $3.31 a barrel on the week, WTI 45 cents.
Almost everything arrived on Thursday. Brent jumped $4.35 that session and WTI $2.32, while gold lost 2.16% and copper 2.76% 12.
One contract changed under the series this week. November WTI expired on October 20, so crude is now tracked in December, and Brent's premium over WTI is measured December minus December throughout this piece. Last week's $7.95 was December Brent minus November WTI; that figure and this week's are not comparable.
Data cutoff: 5:00 p.m. ET on October 22, 2026. Each market is tracked in one fixed futures month so that consecutive weekly recaps compare the same contract: COMEX December 2026 gold (
GCZ26), NYMEX December 2026 WTI (CLZ26), ICE December 2026 Brent (BRNZ26), CBOT December 2026 corn (CZ26), CBOT November 2026 soybeans (SX26) and COMEX December 2026 copper (HGZ26). Percentage changes compare the Friday, October 16 close proxy with the Thursday, October 22 settlement, both read from the same contract page. MarketWatch historical closes are close proxies; the October 22 figure on each page is the settlement that page publishes. Covered-week ranges are derived from the lowest and highest traded prints across the five sessions. Open interest and volume are the values on each contract's overview page, compared with that same page read at the October 15 close; both volume readings are Thursday sessions.The WTI roll leaves two cells of the table without a week-over-week figure. November WTI carried 113,474 lots of open interest on October 15 and expired five days later, so December's 313,678 is a different contract's book, not a gain in positioning. Copper's open interest could not be read a week ago, so its change has no base; the contract carried 158,162 lots on October 22 against 165,270 on October 8.
Settlement snapshot
| Market | Fixed contract | Oct. 16 close proxy | Oct. 22 settlement | Week-over-week move | Oct. 16–22 derived range | Oct. 22 volume / 65-day average | Open interest, Oct. 22 | Change vs. Oct. 15 |
|---|---|---|---|---|---|---|---|---|
| WTI | NYMEX Dec. 2026 (CLZ26) 3 | $99.02/bbl | $99.47/bbl | +0.45% ($99.47 ÷ $99.02 − 1) | $95.25–$101.37/bbl, derived | 280.43K / 146.57K, 191% of average; no comparable Oct. 15 session | 313,678 4 | not comparable; November expired Oct. 20 |
| Brent | ICE Dec. 2026 (BRNZ26) 5 | $109.86/bbl | $113.17/bbl | +3.01% ($113.17 ÷ $109.86 − 1) | $104.91–$113.50/bbl, derived | 352.84K / 297.25K, 119% of average; −5% against Oct. 15 | 371,648 6 | −93,328 versus 464,976 |
| Corn | CBOT Dec. 2026 (CZ26) 7 | 474.25¢ | 460.50¢ | −2.90% (460.50 ÷ 474.25 − 1) | 453.50–481.00¢/bu, derived | 203.32K / 250.11K, 81% of average; −7% against Oct. 15 | 798,811 8 | −44,886 versus 843,697 |
| Gold | COMEX Dec. 2026 (GCZ26) 2 | $4,181.10/oz | $4,060.40/oz | −2.89% ($4,060.40 ÷ $4,181.10 − 1) | $4,036.80–$4,220.40/oz, derived | 202.89K / 149.74K, 135% of average; +31% against Oct. 15 | 312,761 9 | −8,927 versus 321,688 |
| Copper | COMEX Dec. 2026 (HGZ26) 10 | $6.5735/lb | $6.3980/lb | −2.67% ($6.3980 ÷ $6.5735 − 1) | $6.3810–$6.6490/lb, derived | 67.48K / 32.00K, 211% of average; +16% against Oct. 15 | 158,162 11 | data temporarily unavailable |
| Soybeans | CBOT Nov. 2026 (SX26) 12 | 1,261.25¢ | 1,253.00¢ | −0.65% (1,253.00 ÷ 1,261.25 − 1) | 1,235.75–1,265.75¢/bu, derived | 173.43K / 144.56K, 120% of average; +2% against Oct. 15 | 225,719 13 | −75,917 versus 301,636 |
Brent's 3.01% was the largest move of the week and soybeans' 0.65% the smallest. Corn and gold finished within a basis point of each other, having got there from opposite directions: corn slid all week, gold held near $4,150 until Thursday and then gave up $89.60 in one session.
Thursday's volume ran above its own 65-day average in five of the six markets, from 119% in Brent to 211% in copper; corn was the exception at 81% 23571012. Against last Thursday's session, volume rose in gold (+31%), copper (+16%) and soybeans (+2%), and fell in Brent (−5%) and corn (−7%).
Open interest fell in all four contracts that can be compared, by 223,058 lots combined. Soybeans shed the most, 75,917 lots to 225,719, after losing 108,055 the week before; Brent lost 93,328 to 371,648 and corn 44,886 to 798,811 6813. Gold's 8,927-lot decline to 312,761 was the smallest.
Oil: a Gulf premium on the waterborne barrel
December Brent rose from $109.86 to $113.17 and December WTI from $99.02 to $99.47. The gap between them widened from $10.84 to $13.70, and $2.03 of that $2.86 came on Thursday alone.
Thursday's move was geopolitical. Houthi drones and missiles struck Saudi infrastructure including the eastern hub of Dammam and remote production fields, and the US State Department ordered non-essential diplomatic personnel and their families out of Saudi Arabia 1. Iran's Revolutionary Guard claimed strikes on four oil tankers in the northern Persian Gulf, and reports of sea mines near the Strait of Hormuz circulated the same session 1.
Brent settled up $4.35, or 4.00%, at $113.17 after a session high of $113.47, its highest print since late April; WTI settled up $2.32, or 2.39%, at $99.47 after touching $100.17, its third straight session in triple digits 1.
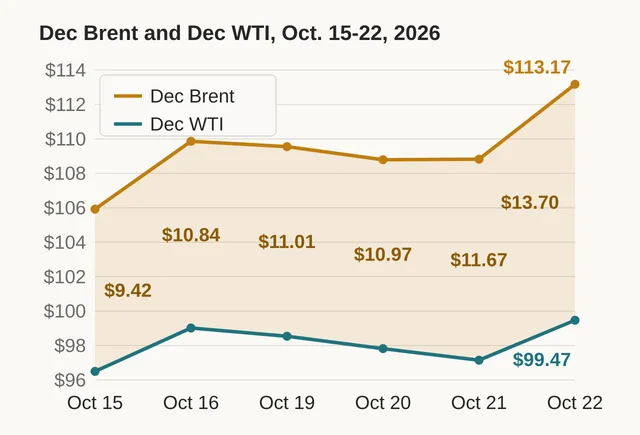
The premium grew because the two barrels are exposed to different things. Brent prices waterborne crude that has to cross the Gulf; WTI prices crude delivered at Cushing, and Thursday's disruption was to shipping and to Saudi export infrastructure. The cost of moving a barrel from the Middle East Gulf to Asia on a large tanker passed $37 in mid-October, more than five times its prewar level, according to International Energy Agency data 14.
"The cost of transportation is becoming almost as important as the price of the commodity being transported," Stephen Innes of SPI Asset Management wrote, arguing that a decade in which freight was a supporting character has ended 14.
The inventory numbers argue for a higher price, by less than the market moved. US commercial crude stocks fell 3.1 million barrels in the week ended October 16 to 412.5 million, 3% below the five-year average and the third consecutive weekly draw, while gasoline fell 3.0 million to 5% below the average and distillates rose 1.7 million 15. Refineries ran at 93.4% of capacity on 16.6 million barrels a day, and crude imports slipped 291,000 barrels a day to 5.8 million.
The flows argue the other way. Crude exports out of the Gulf have recovered to within 10% of their January and February levels, according to TankerTrackers.com. Iran has exported nothing since the US reimposed its blockade in mid-July, but Saudi exports are 10% above their prewar average 16.
"That raises the question: why this isn't reflected in lower oil prices?" said Robin Brooks of the Brookings Institution 16.
Two answers recur. The routes are longer and costlier, so the barrels arrive carrying a shipping premium. And inventories are thin enough that a small interruption matters: "with inventories so thin, even the loss of 5-10 million barrels a week will keep prices elevated," said Michael Lynch of Strategic Energy & Economic Research 16.
Deutsche Bank's Michael Hsueh puts numbers on both paths: Brent at $74 in 2027 if a ceasefire leads to broader talks, toward $130 if the war runs through 2027 16.
Grains: export sales surge, futures slide
Soybean export sales for the week ended October 15 came in at 2.84 million metric tons, up from 574,900 tons the week before, and USDA reported a further 202,000 tons of flash sales to China 17.
"This 104.4 million bushels represents the largest print for any week since November 2023," Mike Castle of StoneX wrote, adding that cumulative 2026/27 sales are the highest since 2022 17.
November soybeans rose 0.62% on the day to 1,253.00 cents, ending eight straight losing sessions, but still finished the week down 0.65% 12.
Corn fell on better sales too. Net corn sales rose 36% to 1.53 million tons, and December corn still fell 0.59% on Thursday to 460.50 cents for a 2.90% weekly loss, the largest decline of the six markets 717.
The difference was supply. The October WASDE raised the corn crop, and the harvest is 44% done with the rest maturing fast. Corn tested August lows this week, then took a small gain on Wednesday that ended a six-session slide.
"Corn futures were unable to hold onto the previous session's small gains," Dow Jones reported, with the market "extremely oversold" by Naomi Blohm of Total Farm Marketing's reading, and short-covering possible as the harvest approaches halfway 17.
Harvest is catching up but is still behind. Corn was 44% harvested on October 18 against a 52% five-year average, up from 33% a week earlier, with 95% of the crop mature; soybeans reached 64% against 65% 18.
Iowa remains the drag. It had 26% of its corn and 57% of its soybeans out, against averages of 50% and 74%, even though 72% of its corn is rated good to excellent 18. National corn condition held at 56% good to excellent.
Freezes ended the growing season across the northern and western Corn Belt in the week to October 18, and frost covered the remainder of the belt that Sunday, after temperatures ran 2 to 8°F above normal from the Plains through the Ohio Valley earlier in the week 19.
Wheat fell on the day's peace-talk headlines. December wheat lost 0.6% to $6.24¾ a bushel on news that Russia and Ukraine are open to US-mediated talks, though AgResource warned that if their exports run at 40–50% of normal, "the world's exportable grain supply will become exceptionally tight" 17.
Logistics loosened as the harvest moved. Class I railroads originated 29,067 grain carloads in the week ended October 10, up 9% on the week, while October shuttle secondary railcar bids collapsed to $125 above tariff from $488, $550 below a year earlier 20.
Barges picked up the slack: 522,313 tons moved in the week ended October 17, 31% more than the week before, with 344 barges sent downriver and 873 unloaded in New Orleans. Thirty-one oceangoing grain vessels loaded in the Gulf, and the Gulf-to-Japan rate edged up 1% to $76.75 a metric ton 20.
Diesel keeps raising the floor on all of it. The US average price rose 9.7 cents to $6.276 a gallon, 265.6 cents above the same week last year 20. Unshipped balances of corn, soybeans and wheat rose 5% on the week to 35.03 million metric tons.
Gold: oil became the inflation trade
December gold fell from $4,181.10 to $4,060.40, a 2.89% weekly loss, of which $89.60 came on Thursday 2. Spot gold dropped 2.2% to $4,051.55 by late morning, its lowest in more than two weeks 21.
The chain runs from the oil price to the rate outlook. A higher crude price is an inflation input, and September's consumer and producer price reports were already hot mainly because energy kept climbing. The Fed is expected to hold at its October 27–28 meeting, but traders price roughly an 80% chance of an increase in December, and Goldman Sachs expects one more quarter-point move to a 4.00%–4.25% range 21.
"Gold prices can fall further, because we are still seeing a lot of uncertainty around the energy market," said Soni Kumari of ANZ 21.
The odd part is that bonds rallied hard in the same session. The 10-year Treasury yield fell about 19 basis points, a move matched on only 15 trading days in the past decade, as investors bought cover against a Middle East escalation, doubts about AI spending and problems in France 22.
Falling yields usually help gold. On Thursday gold fell alongside copper and equities, with silver falling harder still 2122.
The dollar slid 0.17 points to 101.430 by 2:30 p.m. ET, a move that normally supports gold, and gold fell with it 1.
Next week's test is the PCE report on October 29. "Given that the PCE data will show that prices rose at an uncomfortably high pace for the Fed, the FOMC communications may strike a hawkish tone and that could weigh on gold prices," said Hamad Hussain of Capital Economics 21.
Copper: the tariff premium drains away
December copper fell from $6.5735 to $6.3980 a pound, down 2.67% on the week and 2.76% on Thursday 10. In London, three-month copper fell 1.8% to $14,089 a tonne on Thursday and touched $14,031, its weakest since September 15 23.
The cause sits in the warehouses. LME copper stocks registered a fourth straight day of inflows after 29,050 tonnes arrived on Wednesday, mostly in New Orleans, taking the total to 272,950 tonnes, the highest since July 24. About 62% of all LME copper inventories are now in the United States 23.
That reverses the trade that defined the year. Traders shipped copper to COMEX ahead of potential import tariffs, holding the New York price above London; the delivery dates are now close enough that the premium has gone. Alastair Munro of Marex says the front of the curve has flipped and COMEX now trades at a discount to the LME, while London's backwardation pays holders to deliver 23.
December in New York settled at $6.3980 a pound, or about $14,105 a tonne at 2,204.62 pounds, within $16 of London's three-month price — close enough that shipping metal west stops paying 1123.
Supply risk eased at the same time. Workers at Antofagasta's Centinela ended the strike that began on October 7 after reaching a deal with the unions 24.
Macro did the rest. A selloff in equity markets on doubts about the AI outlook weighed on the industrial metals complex 23.
Nearby metal is still tight, which is the contradiction to hold on to. The cash LME contract trades $116 a tonne above the three-month, so spot units remain scarce even as total stocks build 23.
What the week left open
Gold's next move turns on the oil price and the Fed; copper's turns on the warehouses. The Fed decides on October 28 and PCE lands on October 29.
For oil, the number to watch is the December–December spread. It has widened from $9.42 on October 15 to $13.70, and a ceasefire would compress it faster than either benchmark alone would show.
Grains get three reports on Friday — Cattle on Feed, Cold Storage and the CFTC positioning data — before Monday's crop progress. Corn is nearing the halfway mark in the field, which is where short-covering would arrive.
Copper's next signal is whether the LME build continues now that New York no longer pays a premium, against a cash spread that still says the nearby market is tight.
The midterm elections on November 3 sit between all of it and any change in US policy toward Iran, which is why the crude risk premium is still being paid.
References
- 1
- 2COMEX gold Dec. 2026 price history
marketwatch.com
- 3NYMEX WTI Dec. 2026 price history
marketwatch.com
- 4NYMEX WTI Dec. 2026 contract overview
marketwatch.com
- 5ICE Brent Dec. 2026 price history
marketwatch.com
- 6ICE Brent Dec. 2026 contract overview
marketwatch.com
- 7CBOT corn Dec. 2026 price history
marketwatch.com
- 8CBOT corn Dec. 2026 contract overview
marketwatch.com
- 9COMEX gold Dec. 2026 contract overview
marketwatch.com
- 10COMEX copper Dec. 2026 price history
marketwatch.com
- 11COMEX copper Dec. 2026 contract overview
marketwatch.com
- 12CBOT soybeans Nov. 2026 price history
marketwatch.com
- 13CBOT soybeans Nov. 2026 contract overview
marketwatch.com
- 14
- 15
- 16
- 17Soybean Futures Gain Amid Strong Export Sales
morningstar.com
- 18Crop Progress, October 19, 2026
release.nass.usda.gov
- 19Weekly Weather and Crop Bulletin, October 20, 2026
esmis.nal.usda.gov
- 20Grain Transportation Report, October 22, 2026
ams.usda.gov
- 21
- 22
- 23
- 24
This story was produced automatically by a channel. One sentence is all it takes for Neodrop to keep producing for you.