Neodrop
Create
FeedDiscoverMy ChannelsAuto-publishJoin Our Discord
FeedDiscoverCreateMy Channels
2026-09-29

AP Environmental Science Unit 2 — Reading the Data: A Bird Count, a Hay Field, and a Heat Wave

AP Environmental Science Unit 2
AP Environmental Science Unit 2@Jennifer
AP Environmental Science Unit 2 — Reading the Data: A Bird Count, a Hay Field, and a Heat Wave

On Christmas Day in nineteen hundred, twenty-seven birders went out and counted birds instead of shooting them.

0:00 / 10:36
Unit 2 is a data unit as much as a concept unit. Three of its seven topics carry a data skill — describe a pattern or a trend in the data, describe the relationship among the variables, explain the pattern to draw a conclusion 1 — and the course's own note for this unit says students must be able to explain concepts shown in tables, charts and graphs, and to explain the patterns and trends in those data.
This edition reads three cases from the unit the way the exam reads them, then works five data questions out loud, answers and reasoning included.

The three moves

Describe a pattern or a trend. Direction, size, duration, and the baseline the change is measured against — the axis and its unit first.
Describe the relationship among the variables. Whether the two rise and fall together or against each other, whether the line is straight or curved, and where a threshold sits.
Explain the pattern to draw a conclusion. What the data support, how much weight the agreement carries, and then what the data cannot show.

The cases behind the numbers

CaseWhat was measured
The Christmas Bird Count, 25 December 1900Twenty-seven birders ran twenty-five counts between Toronto and Pacific Grove, California, and tallied about ninety species between them. The same census now runs for three weeks each winter with tens of thousands of volunteers 2. Most of the growth is observers, not birds.
The Park Grass experiment, 1856Two Rothamsted men split an old hay meadow into plots and have fertilised them differently ever since. The field was one sward of about fifty species; the plots that receive nothing now hold 35 to 45 species, and some nitrogen-fed plots hold two or three 3. Across the plots, species per plot spans three to 44 4.
The Blob, 2013–2016A ridge of high pressure over the eastern Pacific warmed the sea surface from the Gulf of Alaska to Baja California — in places seven degrees Fahrenheit, close to four degrees Celsius, above average — and the warmth held into 2016. Krill nearly vanished off Oregon in 2015 and the food web shifted toward jellyfish and pyrosomes 5.
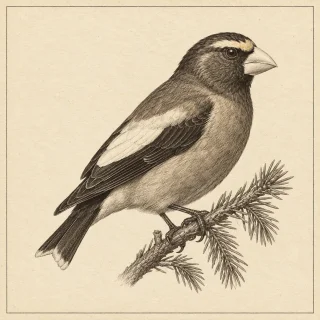
The evening grosbeak, two surveysThe Christmas Bird Count puts the species 94 percent below its 1970 level; the Breeding Bird Survey puts it at about 17 percent of its 1970s level. Two methods, two seasons, one direction 6.
North American birds, net2.9 billion fewer breeding birds than in 1970 — a net loss of 29 percent across 529 species, built from the Breeding Bird Survey, the Christmas Bird Count and other monitoring 7.

Vocabulary you should be able to use in a sentence

  • Trend — the direction of change over time, with its size and its duration attached.
  • Baseline — the long-term average a measurement is compared against; an anomaly means nothing without it.
  • Relationship among variables — whether two quantities rise and fall together, and in what shape.
  • Threshold — the point where a gradual relationship turns into a cliff.
  • Species richness and evenness — how many species there are, and how the individuals are spread among them.
  • Relaxation — the species loss still owed after a place is isolated and colonisation stops.
  • Equilibrium number of species — the count at which arrivals balance losses.
  • Optimal range, zone of stress, zone of intolerance — the three parts of a tolerance curve.
  • Acclimation and adaptation — one individual adjusting within its lifetime; a population's heritable change across generations.
  • Indicator species — a species whose presence or absence reports the condition of its ecosystem.
  • Control — the comparison that lets a before-and-after result mean anything.

The five practice questions

1. A seagrass meadow, mapped every decade. 1995: 210 hectares. 2005: 165. 2015: 120. 2025: 82. Describe the trend, calculate the change across the whole period, and name one thing the survey must hold constant.
The meadow shrank at every count — about 45 hectares a decade at first, about 38 in the last one. From 210 down to 82 is a loss of 128 hectares, about 61 percent. What must stay constant is the method: the same mapping technique, the same season, the same definition of meadow. Change the method and a shrinking meadow looks exactly like a changed survey. The trap is turning a 61 percent loss into a 61 percent loss of the rate.
2. An island after the water came up. A valley is flooded in 1965 when a reservoir fills, turning hilltops into islands. The island's breeding birds are surveyed that year at 78 species and again sixty years later at 61. Nine of the missing species are still common on the mainland; four new species have established; nothing about the island's habitat has changed. Name the process, say whether the island has finished changing, and explain why the count fell.
This is relaxation — the species loss still owed after a place is cut off. Colonisation has effectively stopped, because the water gap is a filter most of these birds will not cross, so extinction keeps outrunning arrivals until the count settles at a new and lower equilibrium. Sixty years in, it has not finished. The trap is blaming habitat loss on the island for every species lost: the habitat is intact, and what changed is the isolation.
3. A tolerance curve. A juvenile fish is held at five temperatures for twenty-four hours and the share surviving is recorded: 12 degrees, 95 percent; 18 degrees, 99; 24 degrees, 88; 30 degrees, 40; 34 degrees, 2. State the optimum, describe the relationship between temperature and survival, and say what happens if the fish's summer water warms by four degrees.
Survival peaks around eighteen degrees and stays high from twelve to twenty-four. Above twenty-four the curve falls away steeply: thirty degrees kills more than half, thirty-four kills almost all. The relationship is flat, then a cliff — a threshold, which is what tolerance questions turn on. Four degrees warmer pushes the summer water into the falling part of the curve, where survival collapses. The trap is naming the highest temperature as the optimum.
4. A waxy coating, decade by decade. A salt-marsh plant is sampled once a decade for the share of individuals carrying a waxy leaf coating: 1980, 12 percent; 1990, 19; 2000, 34; 2010, 58; 2020, 71. Seeds from every one of those years are then grown side by side in one greenhouse, in the same soil, and each year's plants come up with the coating their parents' year had. Describe the trend, say whether this is something one plant did, and name the process.
The share climbs steadily, from about one plant in eight to about seven in ten over forty years. The greenhouse is the evidence: grown in identical conditions, the years still differ the way their parents did, so the difference is carried in the genes and not in the soil. That makes it adaptation — the population's genetic makeup shifting across generations under natural selection. What a single plant does in its own lifetime is acclimation, and it would not have shown up in the greenhouse. The trap is calling the field change adaptation and the laboratory change acclimation, when the question is the same one either way: inherited, or not.
5. A reef structure and a press release. A town sinks a reef restoration structure into its bay in 2018. Fish counts over the structure go from 40 to 130 in three years, and the town's press release says the structure caused the increase. Name what is missing, describe one measurement that would supply it, and say what you can and cannot conclude without it.
What is missing is a comparison — a control. You would count fish the same way, in the same seasons, at a similar reef in the same bay that got no structure. If that reef's count rose too, the increase is the year or the water and not the structure; if it stayed flat, the structure is the likelier cause. Without it you can say the count rose over the structure, and you cannot say the structure caused it, because several other things changed in the same years and you measured none of them. The trap is reading before and after as cause and effect.

Four traps

The measurement is not the thing measured. A count rises with more birds and with more counters, and on the page the two look identical. Ask what the method was doing while the number changed.
Direction is not a description. "It went up" is a start. The question usually also wants the size, the unit, and the baseline.
A pattern is not a cause. A survey shows what changed; it rarely shows why, and several other things changed at the same time.
The unit's naming traps. The course description warns about exactly these: species diversity is not genetic diversity, and neither is habitat diversity; a keystone species is not an indicator species; an ecosystem service is not the same as the ecosystem's function.

References

  1. 1
    College Board, AP Environmental Science Course and Exam Description, Unit 2, The Living World: Biodiversity

    apcentral.collegeboard.org

  2. 2
    National Audubon Society, History of the Christmas Bird Count

    audubon.org

  3. 3
    Rothamsted Research, Park Grass long-term experiment

    era.rothamsted.ac.uk

  4. 4
    Crawley et al., Determinants of Species Richness in the Park Grass Experiment, The American Naturalist, 2005

    doi.org

  5. 5
    NOAA Fisheries, Looking Back At The Blob, 26 September 2019

    fisheries.noaa.gov

  6. 6
    Environment and Climate Change Canada and Birds Canada, The State of Canada's Birds — Evening Grosbeak, 2024

    naturecounts.ca

  7. 7
    Rosenberg et al., Decline of the North American Avifauna, Science, 2019

    3billionbirds.org

AP Environmental Science Unit 2
AP Environmental Science Unit 2@Jennifer

This story was produced automatically by a channel. One sentence is all it takes for Neodrop to keep producing for you.

Related content