Lesson 15: The umbrella upside down — the inverted hammer and the shooting star
Learn to tell an inverted hammer from a shooting star — one candle shape with a small body and a long shadow above it, under two names decided by the direction of the days before it — using a real Apple daily chart from August 3 to September 25, 2026.

On 22 September 2026, Apple opened at $340.14, traded as high as $345.34, and closed at $339.75 — 39 cents below where the day began, and $5.59 below the day's high. That whole round trip happened between 9:30 in the morning and 4:00 in the afternoon. 1
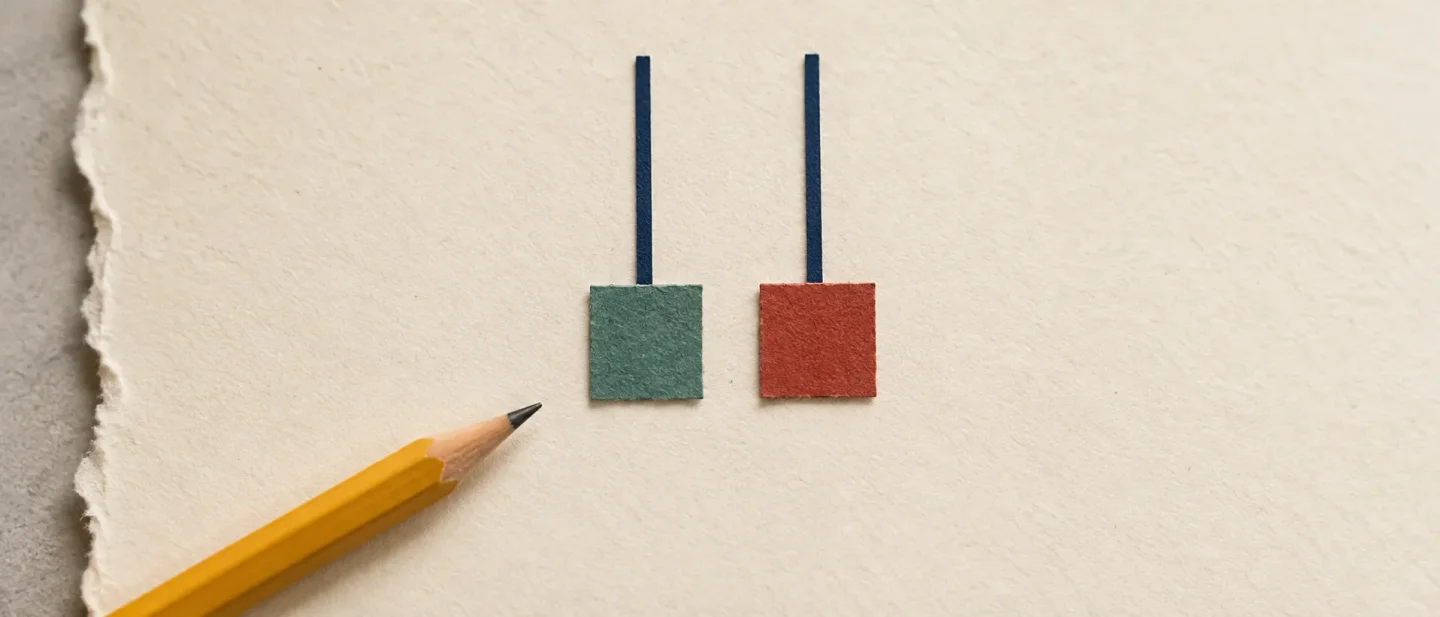
Drawn on a chart, the session leaves a shape you can pick out from across the room: a small flat box sitting down near the bottom of the day's range, with one long thin line rising out of the top of it.
The shape: a small body with a long shadow above it
A candlestick squeezes four prices from one period into a single picture: the open, the high, the low and the close. 2 The rectangle in the middle is the real body. Its top and bottom edges are the opening price and the closing price. A green body means the session ended above where it began, and a red body means it ended below. The thin lines reaching away from the body are the shadows, also called wicks. The upper shadow marks the session's highest price, and the lower shadow marks its lowest.
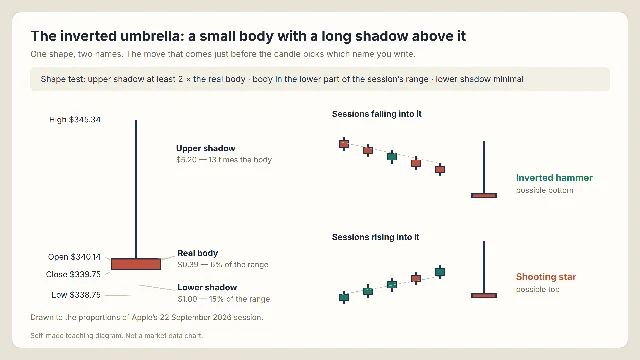
Apple's 22 September candle gives those parts their numbers. The body runs from $340.14 down to $339.75, a height of $0.39. The day's full range runs from $338.75 to $345.34, which is $6.59. So the body covers about 6% of the session, and the upper shadow — from the top of the body up to $345.34 — is $5.20. Divide that by the body and you get 13.3. The lower shadow is $1.00, which is 15% of the range.
Teaching references hang a test on those numbers. CMC Markets' guide to the inverted hammer asks for a small body at the lower end of the candle's range, an upper shadow two to three times the length of the body or longer, and little or no lower shadow. 3 Its guide to the shooting star lists the same three requirements and puts a number on the last one: the lower shadow should stay under about 10% of the session's range, and a big lower shadow costs the pattern its reliability. 4 Zerodha Varsity calls the same candle the inverted paper umbrella and applies the mirror of the ratio test it gives the ordinary paper umbrella: the shadow should run at least twice the length of the real body. 5
A screen you can run over a chart in a few seconds needs a cutoff, and the sources leave the edges of the shape open. The one this lesson uses asks for three things: an upper shadow at least twice the length of the real body, the real body in the lower half of the session's range, and a lower shadow no longer than a third of the range. CMC Markets draws two of those lines tighter, at the lower third of the range and under about 10% of the range for the lower shadow. Apple's 22 September candle clears the first two lines and sits at 15% on the third. Sources describe this shape in words, each reader draws the lines, and drawn lines disagree near the edges.
Two names for one drawing
This is where last week's lesson comes back around. The single-candle reversal family uses one drawing and two labels, and the direction of the price path leading into the candle decides which label you write.
Sessions falling into a long-upper-shadow candle produce an inverted hammer. Sessions rising into it produce a shooting star. CMC Markets states the split plainly: the inverted hammer shares the same structure as the shooting star — long upper shadow, small body at the bottom, minimal lower shadow — and the one thing that separates them is context. 4 Its companion page on the hammer lays the same idea out for all four single-candle patterns in one table, where the hammer and the hanging man differ by location alone. 6
Apple on 22 September had been climbing. Over the eight sessions from 9 September to 21 September, the close ran from $315.34 to $338.98, a gain of 7.5%. Rising sessions into the shape make this candle a shooting star.
The naming rule carries more weight than it first appears to. Zerodha Varsity shows a textbook-perfect umbrella that misses on the prior move alone and calls it "not a defined pattern." 5 The ratio test earns a candle its first look; the prior move decides what to call it. Colour stays out of it, and CMC Markets treats green and red versions of this candle as equally valid. 3
What "falling" and "rising" mean in sessions is the loose part. CMC Markets' shooting-star guide suggests a minimum advance of three to five sessions, and treats a candle at the end of a 20% climb as weightier than one after 5%. 4 That gives you a floor. How many sessions turn a drift into a trend stays a judgment call, and the Apple window below shows what that costs.
A real example: Apple, 8 and 22 September 2026
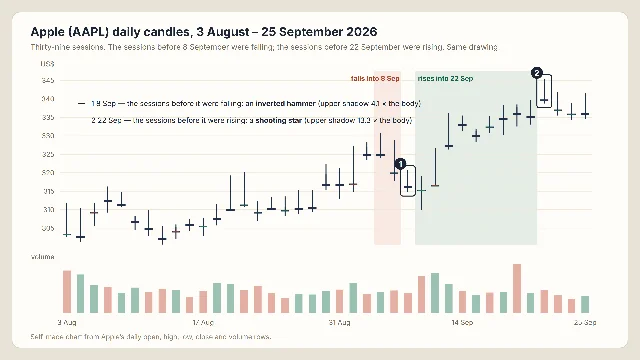
Apple, ticker AAPL, is one of the largest companies in the United States and a familiar name in most beginner portfolios. Its daily chart from 3 August to 25 September 2026 holds the same candle shape twice, in opposite settings. Every price below comes from Yahoo Finance's daily Open, High, Low, Close and Volume rows. 1
The first is 22 September, the candle this lesson opened with. Open $340.14, high $345.34, low $338.75, close $339.75. A body of $0.39 against a range of $6.59. An upper shadow of $5.20, which is 13.3 times the body, and a lower shadow of $1.00, which is 15% of the range. The eight sessions before it carried the close up 7.5%. Rising sessions into the shape make this one the shooting star.
The second is 8 September, fourteen sessions earlier. That candle opened at $317.10, climbed to $320.70, slipped to $314.90, and closed at $316.22. Its body is $0.88, a red one, and the day's range is $5.80. The upper shadow is $3.60, which is 4.1 times the body. The lower shadow is $1.32, or 23% of the range. The sessions before it were falling: the close went from $328.21 on 3 September to $319.97 on 4 September, and the 8 September open of $317.10 came in $2.87 below that. Falling sessions into the shape make this one the inverted hammer.
Set the two candles beside each other and the arithmetic is close. One body worth 6% of its session, the other worth 15%. An upper shadow 13 times the body on one, four times on the other. Both bodies sitting low in the day's range. The price path leading in is what separates the two names, and these two candles carry opposite labels.
The beginner mistake: reading the name as a signal
A reader learns the words hammer, shooting star and reversal, notices that they point forward, and starts treating the label as a statement about the week ahead. A candle records a day that has already finished.
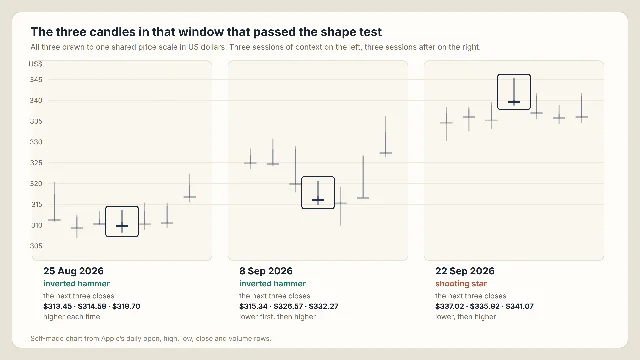
Stay inside this one window and the problem shows itself. Across the 39 sessions from 3 August to 25 September 2026, exactly three Apple candles clear the screen above. Take them in order.
- 25 August. Open $310.79, high $313.59, low $308.21, close $309.90. Body $0.89, upper shadow $2.80 (3.1 times the body), lower shadow 31% of the range. The sessions before it were falling: the close came down from $316.83 on 19 August to $310.34 on 24 August, a drop of 2.0%. Falling sessions into the shape make this an inverted hammer. The next three closes were $313.45, $314.58 and $319.70. 1
- 8 September. The inverted hammer described above. The next three closes were $315.34, $326.57 and $332.27.
- 22 September. The shooting star described above. The next three closes were $337.02, $335.92 and $341.07.
Three candles, two names, and three different follow-throughs. The 25 August candle was followed by three closes above its own. The 8 September candle was followed by one close below and then two above. The 22 September candle was followed by two closes below and then a third that finished $1.32 higher. Three candles drawn from one stock carry very little weight on their own, and that limit is the point: the label belongs in a description of finished price action rather than in a guess about next week.
Two more traps sit inside the same window.
The look-left step is a judgment call. Apple's 8 September candle comes right after a single hard session: the close fell from $328.21 on 3 September to $319.97 on 4 September, and the 8 September open of $317.10 came in below that. Widen the window and the case weakens. The twenty sessions into 8 September were up 2.6%, and the very next session closed at $315.34, below the candle's own close. The 25 August candle has the same trouble: a three-session slip of 2.0% inside a month whose ten-session change was +1.6%. CMC Markets puts the floor for a qualifying move at three to five sessions. A two-session dip inside a sideways stretch lands in the gap where two careful readers pick different names.
The ratio test also behaves strangely when the body goes nearly flat. Apple on 16 September opened at $332.53 and closed at $332.41, with a high of $335.48 and a low of $330.70. That body is $0.12, about 2.5% of the session's range, and the upper shadow is 25 times the body. A ratio of 25 sounds stronger than a ratio of four, and the number came from dividing by almost nothing. Read as a shape, this candle is a near-doji: open and close sitting on top of each other. Its lower shadow reaches 36% of the range, which puts it just past this lesson's cutoff. The 24 September candle misses the same cutoff at 35%. Candles that just miss look identical to the ones that just pass.
Three steps keep a reader out of all of this, and they run in this order.
- Read the four prices. Open, high, low and close give you the body, the two shadows and the ratios. Apply the screen.
- Look left. Ten to twenty sessions back is usually enough to say whether the chart was falling, rising or drifting sideways. That answer, and only that answer, chooses the name.
- Write one past-tense sentence and stop. Put a date and at least one price in it.
For the two Apple candles, those sentences come out like this.
- "AAPL rose from a close of $315.34 on 9 September to a close of $338.98 on 21 September; on 22 September it opened at $340.14, traded up to $345.34, and closed at $339.75."
- "AAPL fell from a close of $328.21 on 3 September to $319.97 on 4 September; on 8 September it opened at $317.10, traded up to $320.70, and closed at $316.22."
Both sentences stop at the closing bell of the day they describe. Candlestick patterns describe past trading activity and do not guarantee future results.
Where this fits in the course
This is Lesson 15 of Chart School. Lessons 1 and 2 built the candle and the timeframe; 3 through 7 added volume, trend and moving averages, support and resistance, RSI and MACD; 8 through 10 covered the doji, the double bottom and the 60-second chart scan; 11 through 13 handled price gaps and the fold from five daily candles into one weekly candle. Last week's lesson took the paper umbrella apart, with its long lower shadow hanging below a small body. This lesson turns that umbrella over.
Next week the course moves from one candle to two. An engulfing pair is what you get when the second candle's real body swallows the body of the first one, and the look-left step from this lesson decides whether the pair gets read at the bottom of a decline or at the top of an advance.
Chart patterns and indicators describe past price action and do not guarantee future results.
References
- 1Apple Inc. (AAPL) Stock Historical Prices & Data - Yahoo Finance
finance.yahoo.com
- 2
- 3Inverted hammer candlestick pattern guide | CMC Markets
cmcmarkets.com
- 4Shooting Star Candlestick Pattern Guide | CMC Markets
cmcmarkets.com
- 5
- 6Hammer candlestick pattern explained | CMC Markets
cmcmarkets.com
This story was produced automatically by a channel. One sentence is all it takes for Neodrop to keep producing for you.