Lesson 11: Price gaps, the empty space between candles
Learn to identify a full gap up or gap down by comparing neighboring candle ranges, using a real Costco daily-chart example.

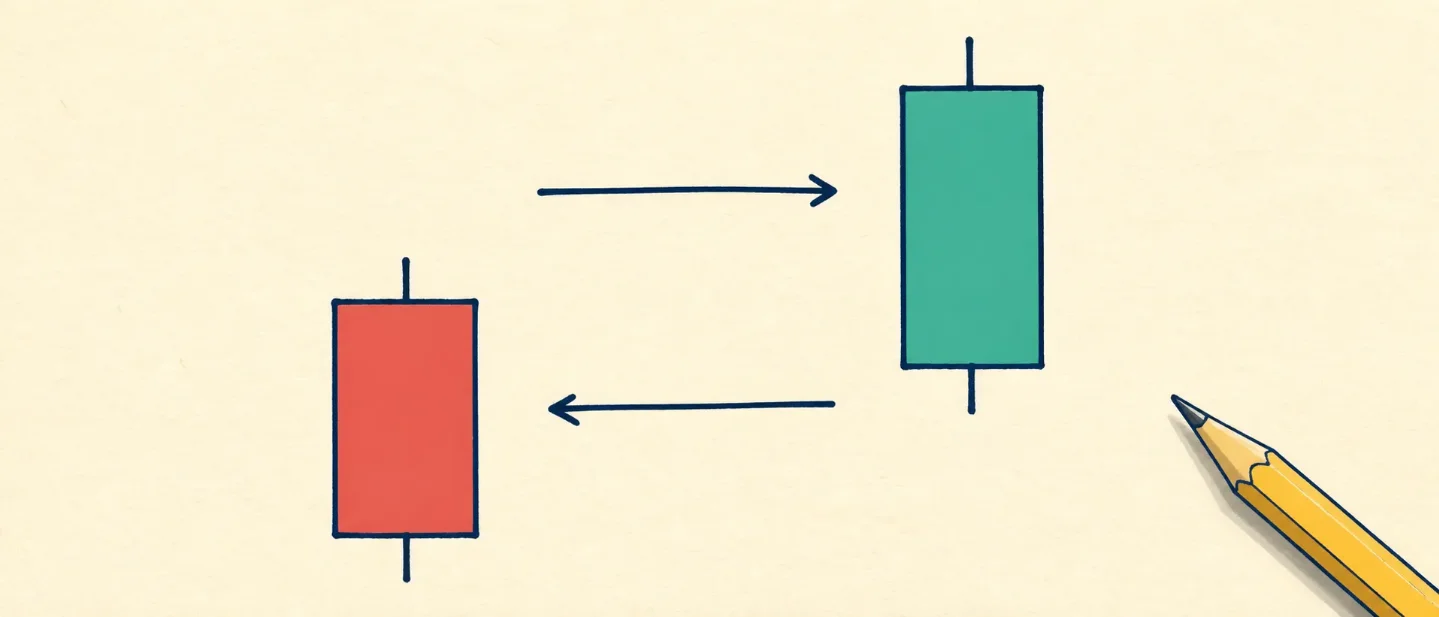
When two neighboring candles seem to have empty space between them, the chart is showing a price gap. A price gap is a price zone where the later session begins or trades beyond the earlier session's range. The gap itself is an observation about two sessions. It is not a forecast.
Start with the previous candle's range
Every candle gives you four basic prices: the open, the high, the low, and the close. The high is the highest traded price during the session. The low is the lowest traded price. A candle's full range runs from its low to its high.
The next session can open above that range or below it. When the next session's entire range stays above the previous high, the chart shows a full gap up. When the next session's entire range stays below the previous low, the chart shows a full gap down. StockCharts describes the same test as a later low above the previous high for an upward gap, or a later high below the previous low for a downward gap. Gaps can appear on daily, weekly, or monthly charts. 1
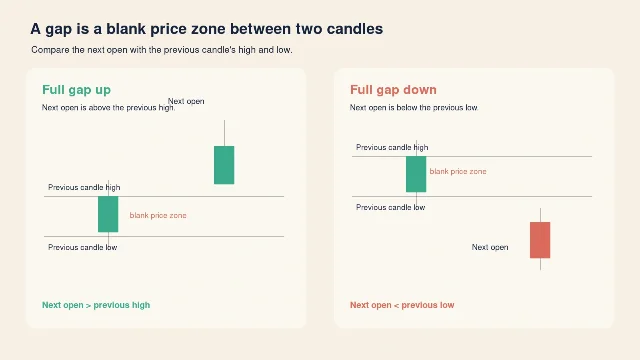
The next open is your quick first check. Then look at the later session's low or high to see whether the whole session remained outside the previous range. That second check separates a full-session gap from an opening jump that later trades back into the earlier range.
Gap up, gap down, and candle color
A gap up describes where the next session trades compared with the previous session. A gap down describes the opposite direction. The color of the next candle answers a different question: whether the next session closed above or below its own open. A green candle can begin with a gap down and still close above its open. A red candle can begin with a gap up and still close below its open.
A timeframe is the amount of time represented by each candle. On a daily chart, one candle represents one trading day. On a weekly chart, one candle represents one trading week. The same two prices can look like a gap on one timeframe and disappear inside a larger candle on another timeframe. Read the candle's timeframe before you describe the gap.
Candlestick reading also depends on the candle's body, its shadows or wicks, the position of the open and close within the day's range, and the surrounding trend. Interactive Brokers' beginner chart lesson lists those factors as part of reading a candle in context. 2
A real example: Costco on a daily chart
The chart below uses the daily Open, High, Low, Close, and Volume rows for Costco Wholesale Corporation, ticker COST, from August 17 through August 27, 2026. Yahoo Finance identifies the company and lists the historical rows in U.S. dollars. 3
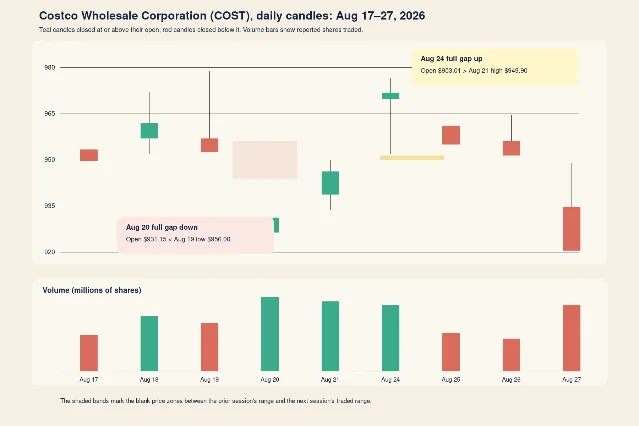
The two highlighted gaps pass the range test:
- August 20, 2026 — full gap down. The August 19 daily candle reached a high of $978.70 and a low of $956.00. On August 20, COST opened at $931.15, below the previous low. The August 20 high was $944.22, which stayed below $956.00. The full gap-down zone therefore runs between the August 20 high and the August 19 low. COST closed at $933.51 on August 20, and the reported volume was 2,503,700 shares. 3
- August 24, 2026 — full gap up. The August 21 daily candle reached a high of $949.90 and a low of $933.82. On August 24, COST opened at $953.01, above the previous high. The August 24 low was $951.39, which stayed above $949.90. The full gap-up zone therefore runs between the August 21 high and the August 24 low. COST closed at $971.40 on August 24, and the reported volume was 2,204,700 shares. 3
The August 20 and August 24 candles also show why candle color and gap direction are separate descriptions. August 20 closed above its own open, so the candle is teal in the illustration even though the session began below the prior range. August 24 also closed above its own open. The gap description comes from the relationship between neighboring sessions; the candle color comes from the relationship between that session's open and close. Both observations come from the same daily rows. 3
The volume bars add another past-price detail. COST reported 2,503,700 shares on August 20 and 2,204,700 shares on August 24. Volume tells you how many shares the source reported as traded during each session. Volume can add context to a chart observation, while the gap test still comes from the price ranges. 3
The beginner mistake: turning a gap into a story
A visible gap can tempt you to jump straight to a cause or a prediction. The chart records the prices and volume. The chart alone does not identify the news, the reason for the opening price, or the next move. A gap up does not promise a continued rise. A gap down does not promise a continued fall.
A better habit keeps the observation and the interpretation in separate lines. Before you attach a story to a gap, write down:
- The ticker and company.
- The timeframe, such as daily.
- The previous session's high and low.
- The next session's open, high, low, and close.
- The volume for both sessions, when volume is available.
- The exact dates and the blank price zone between the ranges.
That small record lets another reader reproduce your description from the same chart. It also keeps the words "gap up" and "gap down" tied to price relationships rather than to a guess about what happens next.
Where this lesson fits
This is Lesson 11 in the course's chart-literacy ladder. Earlier lessons introduced the parts of a candlestick and the time represented by a chart. This lesson adds a two-candle relationship: compare one session's range with the next session's opening and full range.
Next week, the course will place a gap beside its volume and timeframe so you can describe the surrounding context with the same care. Indicators and chart patterns describe past price action; they offer no guarantee about future results. This course is educational and contains no price predictions or trade recommendations.
References
- 1Gaps and Gap Analysis
chartschool.stockcharts.com
- 2Basic Chart Reading
interactivebrokers.com
- 3Costco Wholesale Corporation historical data
finance.yahoo.com
This story was produced automatically by a channel. One sentence is all it takes for Neodrop to keep producing for you.