
Gold at $4,369: XAUUSD Weekly Trading Map for Sep. 21–25, 2026 — Gold Higher After the Hike, 10-Year at 5%
A probability-weighted XAUUSD trading map for Sep. 21–25, 2026, built around the $4,373.05–$4,405.59 decision band, with the first real read on how the Fed's hike, 5% yields and record ETF demand set the week's levels.

Spot gold reopens the week at $4,369.22 after closing higher for the first week in four — a week in which the Federal Reserve raised interest rates for the first time in three years and the 10-year Treasury yield pushed back to 5%. The metal reopening just below $4,373.05, the floor of the zone that stopped Friday's rally, is the week's first decision line. 12
Data cutoff: 2026-09-21 08:06 GMT+8. Live feeds differ slightly at the reopen: CNBC shows $4,369.22 (−$7.69, −0.18%, previous close $4,376.91), FXEmpire shows $4,370.87, and Investing.com's technical page shows $4,372.08. Treat the $4,369–$4,372 area as the reopen zone and anchor levels to it. 134
Loading stats card…
The decision in one minute
- Bias: the bounce owns the momentum and the structure has yet to confirm it. Gold trades above the 50-day, 100-day and 200-day simple averages in Investing.com's daily table, while the swing-chart trend on FXEmpire's spot chart still reads down and the market prices a 59.7% chance of another hike at the October 28 meeting. 456
- Bull path: reclaim and hold $4,373.05 on a 1-hour close, then take a 4-hour close above $4,405.59. That opens the larger band at $4,466.14–$4,520.65, with $4,510.93 the level that flips the daily trend higher. 5
- Bear path: a 1-hour close under $4,362.17 puts Friday's low at $4,334.295 in play, then $4,319.60 and the $4,300–$4,320 band. A daily close below the 50-day average at $4,288.76 exposes the post-Fed low of $4,235.17, which is where the downtrend resumes. 45
- Trade location: the classic daily pivot sits at $4,376.45, so the reopen is a few dollars below equilibrium. Entries belong at the edges of the $4,373.05–$4,405.59 band, where the week's first real test will be fought. 4
- Main catalyst: ten scheduled Fed appearances, Thursday's jobless claims and new home sales, Friday's revised University of Michigan inflation expectations, and crude's response to Saturday's Houthi missile and drone strikes on Riyadh. 78
What the Fed did, and what the market did with it
The Federal Open Market Committee raised the target range for the federal funds rate by a quarter of a percentage point to 3.75%–4% on September 16, in a statement approved 12–0. The committee's wording was explicit about why: "Inflation remains elevated. Today's policy action will support a timelier return to the Committee's 2 percent goal. The Committee will deliver price stability." 9
Chair Kevin Warsh used his press conference to close the door on interpreting the move as a formality. "This summer's inflation readings do not tell me that underlying trends have meaningfully improved," he said. "Inflation is too high and has been for too long." 10
Rates repriced immediately. The 10-year note yield moved above 5% to 5.016% and the 2-year rose more than 7 basis points to 4.738%, after the 10-year had already set a 2007 high on Tuesday the 15th. Spot gold fell 1.2% to $4,240.1 by 3:10 p.m. ET on decision day, a near six-week low, having touched $4,365.57 earlier in the same session. 1011
Then it reversed. Gold gained more than 2% on Thursday, 0.84% (+$36.545) on Friday to settle at $4,378.385, with Friday's range running $4,334.295 to $4,399.67, for a weekly gain of about 1%. 2512
Two things the sell side ran out of. Oil stopped rising — Brent fell for a third straight session through Friday — and the trade built on it lost its inflation argument. Chris Gaffney, president of world markets at EverBank, described the second: "Precious metal investors had expected a (US) rate hike and piled into short positions to take advantage of the expected selloff in gold. These positions have been rapidly unwound." 213
Positioning was only part of the bid underneath. FXEmpire's Vladimir Zernov noted that the bond selloff pushing yields to 5% is driven by worries about the longer-term sustainability of U.S. finances, which makes a bond market selloff a gold catalyst as well as a yield headwind. The World Gold Council made the same connection about August demand: rising long-term yields and the Treasury's August 19 intervention heightened fiscal-sustainability and currency-debasement concerns, and investors bought gold against them. 1415
Confirmed technical structure
Investing.com's daily table reads Neutral on balance, with moving averages on a Buy and technical indicators on a Sell. RSI(14) sits at 52.77, MACD(12,26) at 9.06, ADX(14) at 23.986, and ATR(14) at 15.8763, flagged as lower volatility. The momentum readings that matter here are the two that turned: MACD is positive and Stochastics(9,6) reads 67.498. 4
The simple moving averages have compressed into a $4,325.76–$4,376.83 band, which is what a market looks like when a downtrend stops trending:
| Average | Value | Signal |
|---|---|---|
| MA5 | $4,376.83 | Sell |
| MA10 | $4,371.95 | Buy |
| MA20 | $4,375.58 | Sell |
| MA50 | $4,344.87 | Buy |
| MA100 | $4,325.76 | Buy |
| MA200 | $4,345.76 | Buy |
Investing.com's wider average summary reads Buy, on eight buy signals against four sells across its simple and exponential series; in the simple column shown here, every average from the 50-day out reads Buy. The gap between the MA5 and MA20 cluster and the MA50, MA100 and MA200 cluster is roughly $30, narrower than two average daily ranges. 4
One measurement conflict belongs on the record before any level is traded. On FXEmpire's OANDA-based spot daily chart, the 200-day simple average sits at $4,541.23 and the 50-day at $4,288.76, which puts spot gold well below its 200-day line. Investing.com's table shows a 200-day average of $4,345.76 on its own feed, which puts spot above it. The two vendors disagree by about $195, and this issue treats the $4,288.76 50-day and the $4,319.60 support shelf as the levels the price actually responds to. 45
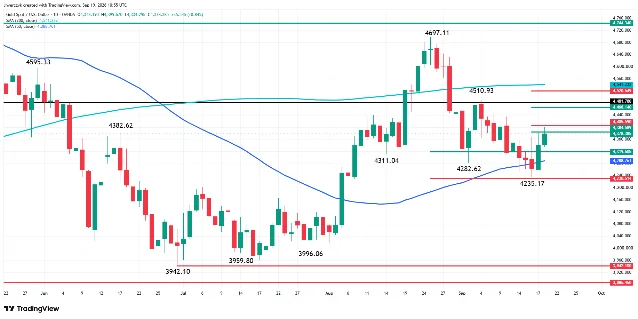
Working channel for Sep. 21–25
| Zone | Price level | Trading rule |
|---|---|---|
| Best sell zone / overhead supply | $4,405.59–$4,440 | Friday's high of $4,399.67 stalled at the bottom of this band. Shorts need a 1-hour rejection close back under $4,399.67. 25 |
| Breakout gate | Above $4,405.59 | A 4-hour close above the level followed by a successful retest opens $4,466.14 to $4,520.65. $4,510.93 flips the daily trend up. 5 |
| Working midline / classic pivot | $4,376.45 | The equilibrium reference. Price inside $4,370–$4,385 with no catalyst is the worst place on the board to initiate. 4 |
| Immediate decision line | $4,373.05 | The floor of the minor retracement band and the level lost into the reopen. A 1-hour close back above it, with a higher low, is the first long trigger of the week. 5 |
| Immediate defense shelf | $4,362.17–$4,367.80 | Classic S3 and S2. A 1-hour hold here offers a tactical bounce toward $4,376 and $4,390. 4 |
| Best buy zone / structural floor | $4,300–$4,320 | The 50-week EMA near $4,300 held the whole of last week's selloff. Longs want a sweep of $4,319.60 followed by a 1-hour close back above it. 1416 |
| Breakdown gate | Below $4,288.76 | A daily close under the 50-day average targets $4,270 and then $4,235.17, the post-Fed low that must hold or the recovery was short covering. 5 |
False-breakout warning: Friday's high of $4,399.67 stopped short of the $4,405.59 band top and just under the round $4,400 level. A probe of $4,400–$4,406 that closes back below $4,399.67 on the hour is a bull trap; a wick under $4,362 that reclaims $4,373 is bear-trap absorption. 5
Volatility context: ATR(14) at 15.8763 puts average daily travel near $16, down from roughly $22 the previous week. The reopen sits $36 below the $4,405.59 gate — about 2.3 average days — and $50 above the $4,319.60 shelf, about 3.1 average days. Both edges are reachable inside the five sessions; the $134 distance to the post-Fed low is about 8.4 average days and needs a macro catalyst. 4
Macro and fundamental drivers
The rate path is now the market's main input, and it leans against gold. Investing.com's Fed Rate Monitor, built on CME Group 30-day fed funds futures, puts a 59.7% probability on a quarter-point increase to 4.00%–4.25% at the October 28 meeting, against 40.3% for holding at 3.75%–4.00%. A week earlier the split was 43.2% and 49.6%, so pricing has shifted about 16 points toward another hike in five sessions. Out to December 9, the most likely outcomes are 4.00%–4.25% at 45.1% and 4.25%–4.50% at 44.8%. 6
Snapshot providers differ in the details. Reuters, citing the CME FedWatch tool on Friday, reported traders at a 55% chance of another hike in October; FXEmpire cited FedWatch at 57.6%. Those are same-day readings from different time stamps, and they bracket the Investing.com figure rather than contradicting it. 214
Yields have done the damage in nominal terms. CNBC's 10-year quote shows 5.00% against a previous close of 4.996%, and the 30-year sits at 5.331%. 1718
The real-yield series is where this week's report adds something the previous four issues could not. The Federal Reserve Bank of St. Louis reports the 10-year TIPS real yield at 2.61% on September 17, up from 2.43% on September 8 — it peaked at 2.68% on decision day itself. The 5-year real yield sits at 2.46%, and the 10-year breakeven inflation rate at 2.33%, unchanged over the FOMC week. Real yields near 2.6% are the highest cost of holding gold in this cycle, and the metal rose into them. 192021
The dollar added to the pressure. CNBC's ICE U.S. Dollar Index shows 100.276, up 0.054 on the session, with a day range of 100.203 to 100.296 and a 52-week range of 95.55 to 101.80. Reuters described the greenback as reaching a more than seven-week high on Friday, from 99.65 on Tuesday. 21822
Energy is the swing factor. Brent crude traded at $104.68 a barrel on Monday morning and WTI at $101.06 after Yemen's Iran-backed Houthis launched missile and drone strikes at Riyadh on Saturday, with Washington and Tehran still in stalemate. The Strait of Hormuz disruption has already pushed the 20-port average bunker fuel price to $901.50 a metric ton from $543.50 on February 27, and QatarEnergy says the crisis may delay some expansion projects. 82324
| Fundamental factor | Current verified status | Positive gold catalyst | Negative gold catalyst |
|---|---|---|---|
| Fed policy path | Target range 3.75%–4.00% after the September 16 hike, approved 12–0. 9 | Speakers treat the hike as a single recalibration; October passes without a move. | Ten appearances this week confirm a December follow-up; the 59.7% October probability holds. |
| Nominal yields | 10-year 5.00%, 30-year 5.331%. 17 | A retreat under 4.95% after the FOMC week. | A weekly close above 5.02%, the FOMC-day high. |
| Real yields | 10-year TIPS 2.61% on September 17, from 2.43% on September 8. 19 | Real yields rolling over as breakevens rise. | Real yields pressing back toward the 2.68% decision-day peak. |
| U.S. dollar | DXY 100.276, inside a 95.55–101.80 52-week range. 18 | A rejection back under 100.20. | A push toward the June high at 101.80. |
| Energy and geopolitics | Brent $104.68, WTI $101.06 after strikes on Riyadh. 8 | A renewed oil spike revives inflation-hedge demand and fiscal worry. | The same spike re-arms the hike case and lifts yields further. |
| ETF demand | August inflows US$18bn, holdings a record 4,189t. 15 | Continued Western accumulation at record tonnage. | Momentum buyers reversing if price loses $4,300. |
| Official sector | July net central-bank buying 23t; PBoC added 20t in August. 2526 | A 22-month PBoC buying streak continuing through September. | Russia and Turkey sales continuing to offset emerging-market purchases. |
Demand evidence: records in the funds, steady official buying
August was the second-largest month of inflows on record. Global gold ETFs added US$18bn, lifting assets under management 16% to US$615bn and collective holdings by 121t to 4,189t, a record. Europe led with US$7.9bn, its strongest month ever, including US$4.4bn in the UK and US$1.5bn in France. North America added US$7.7bn, its third-largest month, with roughly US$4bn of that arriving in the week of August 17 alone. Asia added US$2bn. Year to date, inflows total US$29bn, equivalent to 160t of metal. 15
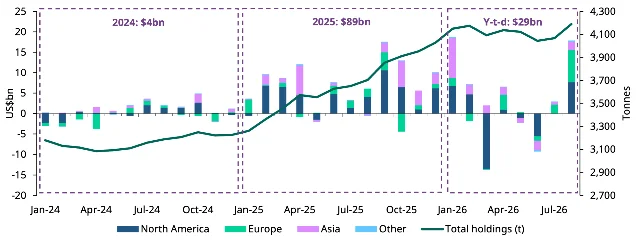
The official sector kept buying at a slower pace. Central banks reported net purchases of 23t in July, led by China with 20t and Poland with 8t, while Russia sold 6t and Turkey, Jordan and Uzbekistan each sold 1t. Year to date, reported purchases total about 130t, down from roughly 160t in the same period of 2025. Poland has bought 90t this year and holds 640t against a 700t target; China's reserves stand near 2,366t at the end of July, its 21st consecutive month of buying. 25
August's Chinese data pushed the streak further. The People's Bank of China bought 20t, its largest monthly purchase since October 2023, taking official holdings to 2,387t by the end of August, a 22nd consecutive month and about 9% of total reserves. Chinese gold ETFs added 11t to 293t, with assets rising RMB10bn (US$1.5bn) to RMB282bn (US$42bn). Chinese wholesale demand ran the other way: Shanghai Gold Exchange withdrawals fell 22% month on month and 27% year on year to 62t. 26
News impact table, Sep. 21–25
Times are GMT+8. Consensus figures come from FXEmpire's week-ahead schedule; Fed events come from the Federal Reserve's September calendar. 727
| Date & time (GMT+8) | Scheduled event | Consensus / status | Expected impact | Bullish / bearish transmission |
|---|---|---|---|---|
| Mon Sep. 21, 18:30 | Chicago Fed President Austan Goolsbee speaks | FOMC voter | Medium | The first read on how the committee reads its own hike. A calibrated tone supports gold; an inflation-first tone does not. 7 |
| Tue Sep. 22, 20:15 | ADP weekly employment change | Prior 16.3K | Medium | Softer weekly hiring eases the hike path and lifts gold; a strong print reinforces it. 7 |
| Tue Sep. 22, 22:00 | Richmond Manufacturing Index | Forecast 5, prior 4 | Low to medium | A factory miss softens the dollar; a beat keeps yields firm. 7 |
| Tue Sep. 22, 22:05 and 22:20 | New York Fed President John Williams and Vice Chair Philip Jefferson speak | 2026 Treasury Market Conference | High | Both sit close to the policy centre. Any framing of the hike as one-and-done is the week's biggest bullish risk to the short side. 727 |
| Wed Sep. 23, 01:00 | Richmond Fed President Thomas Barkin speaks | 2027 voter | Low | Commentary only; watch for a split over how much further tightening is needed. 7 |
| Wed Sep. 23, 21:45 | Flash manufacturing PMI | Forecast 53.4, prior 53.9 | Medium | A sub-53 print weakens the tightening case and helps gold. 7 |
| Wed Sep. 23, 21:45 | Flash services PMI | Forecast 56.0, prior 56.5 | High | Services pricing is the Fed's stated problem. A hot print presses gold toward $4,345; a miss opens $4,405.59. 7 |
| Wed Sep. 23, 22:05 | Governor Michael Barr speaks | Board governor | Medium | Barr argued in September for acting decisively if inflation moderates insufficiently. 27 |
| Thu Sep. 24, 20:30 | Initial jobless claims | Forecast 201K, prior 196K | High | Claims above 210K relieve post-hike pressure; a sub-200K print keeps 5% yields in place. 7 |
| Thu Sep. 24, 22:00 | New home sales, August | Forecast 619K, prior 607K | Medium | Housing strength supports the hawkish case; a miss softens it. 7 |
| Fri Sep. 25, 02:00 | Senior Credit Officer Opinion Survey | Federal Reserve release | Low | A read on dealer financing conditions; matters only if it flags funding stress. 27 |
| Fri Sep. 25, 20:30 | Durable goods orders, August | Forecast −0.3%, prior 1.1% | Medium | A capital-goods miss trims rate expectations and supports gold into the weekend. 7 |
| Fri Sep. 25, 22:00 | Revised University of Michigan sentiment and inflation expectations | Sentiment forecast 47.5, prior 47.8; one-year inflation expectation prior 4.6% | High | The week's main economic release. A lower one-year expectation removes pressure; a higher one hardens the October hike case. 7 |
The next inflation read that can move the October decision sits outside this window: the Bureau of Economic Analysis publishes Personal Income and Outlays for August on September 30 at 20:30 GMT+8. 28
Five-day probability outlook
The weekly distribution is range-bound 40% / bullish continuation 35% / bearish rejection 25%. The range weight reflects a compressed moving-average band, ATR(14) at 15.88, no top-tier U.S. release on Monday, and a Fed calendar this week that schedules ten Fed speeches and no policy decision. The bullish weight comes from momentum that turned on the daily chart, price holding above the 50-day, 100-day and 200-day lines in Investing.com's table, and demand at record tonnage. The bearish weight comes from a 10-year at 5%, real yields at 2.61%, a 59.7% chance of an October hike, and an open seven dollars below the decision line.
| Day | Bullish scenario | Range scenario | Bearish scenario | Pivot variable & condition |
|---|---|---|---|---|
| Mon Sep. 21 | 35%: reclaims $4,373.05 and pushes $4,390–$4,405 | 40%: $4,360–$4,390 | 25%: loses $4,362.17 and tests $4,345 | Crude's response to the Riyadh strikes and Goolsbee's tone. |
| Tue Sep. 22 | 35%: holds $4,373 and probes $4,405.59 on a soft ADP weekly | 40%: $4,365–$4,400 ahead of Williams and Jefferson | 25%: a firm ADP plus a hawkish Williams puts $4,334 in play | Williams' and Jefferson's rate-path language. |
| Wed Sep. 23 | 30%: a soft services PMI opens $4,405.59 | 40%: $4,360–$4,400 around the flash PMIs | 30%: a hot services print and firm crude press $4,345–$4,334 | Flash services PMI prices and the EIA crude number. |
| Thu Sep. 24 | 30%: claims above 210K lift gold toward $4,415 | 35%: $4,355–$4,405 | 35%: strong claims and housing data expose $4,319.60 | Jobless claims and the day's three Fed speakers. |
| Fri Sep. 25 | 35%: a durable-goods miss and a lower one-year expectation clear $4,405.59 | 35%: $4,370–$4,410 into the close | 30%: sticky inflation expectations and weekend risk reduction send gold to $4,319.60 | The one-year Michigan inflation expectation and weekend Middle East risk. |
A confirmed weekly turn requires a 4-hour close above $4,405.59 that holds on retest. A structural failure requires a daily close below $4,288.76, which would put the $4,235.17 post-Fed low back in play.
Actionable trading strategy
Long setup: reclaim of the retracement floor
- Entry zone: $4,360–$4,374.
- Trigger: a 1-hour close back above $4,373.05 with a higher low in place, while the 10-year yield holds below 5.02% and Brent stays under Monday's high.
- Targets: $4,399.67, then $4,405.59, with a runner toward $4,440.
- Defined invalidation: $4,344 on a sustained 1-hour close below it, where the MA50 and MA200 of Investing.com's table sit together.
Long setup: confirmed breakout hold
- Entry zone: $4,408–$4,425 after a 4-hour close above $4,405.59.
- Trigger: a retest of $4,405.59 that holds as new support, with DXY back below 100.20. 18
- Targets: $4,466.14, then $4,500, with $4,520.65 as the outer objective. 5
- Defined invalidation: $4,384 on a 4-hour close back inside the band.
Short setup: rejection at overhead supply
- Entry zone: $4,398–$4,412.
- Trigger: a 1-hour rejection wick or a bearish engulfing close back under $4,399.67, with the 10-year yield at or above 5.00%. 17
- Targets: $4,373.05, $4,362.17, then $4,345.
- Defined invalidation: $4,428 on a sustained 1-hour close above the band top.
Short setup: breakdown retest
- Entry zone: $4,310–$4,326, taken only after a 1-hour close below $4,319.60.
- Trigger: a relief bounce that fails to reclaim $4,326, confirmed by a bearish hourly close with DXY holding above 100.30. 18
- Targets: $4,288.76, $4,270, then $4,235.17. 5
- Defined invalidation: $4,352 on an impulsive reclaim of the $4,362 shelf.
No-trade conditions
- Rotation inside $4,362–$4,390 without an edge confirmation.
- The 30 minutes either side of the Williams and Jefferson appearances at 22:05 and 22:20 GMT+8 on Tuesday. 7
- The first five minutes after any Fed speaker begins, before an hourly candle closes.
- Broker spreads wider than $1.50 in late U.S. or early Asian hours.
- Crude making a new weekly high at the same time the 10-year yield makes a new weekly high, a combination that produced two-way whipsaw through the FOMC week.
- Any setup whose invalidation sits closer than one average daily range, $16 with ATR(14) at 15.88. 4
Risk warnings and data gaps
Main risk: the October 28 meeting. A 59.7% probability of another quarter-point hike is already priced, and ten Fed appearances this week can raise it. If the committee's speakers convert the September move into a stated sequence with a December follow-up, the case that held gold up through the hike — fiscal worry and inflation hedging — competes with a rate path that keeps real yields near 2.6%. 619
Fake-move risk: last week's rally came on falling crude and unwound shorts. Saturday's strikes on Riyadh put crude back on the offer Monday morning, which removes one of the two drivers behind Friday's close. Gold also left a precise marker at $4,399.67, and the zone above it has now rejected price once. 28
News risk: the calendar compresses into Thursday and Friday. Jobless claims, the current account and new home sales all print at 20:30 and 22:00 GMT+8 on Thursday, and durable goods plus the revised Michigan inflation expectations land in the same two-hour window on Friday, when weekend Middle East risk also enters pricing. Spread widening and slippage can make tight invalidations ineffective. 7
Explicit data gaps in this issue: continuous native 4-hour and 1-hour spot OHLC remains unavailable, so treat every intraday level above as an execution condition to be confirmed on your own feed; the live CME FedWatch table did not render, and the rate probabilities here come from Investing.com's Fed Rate Monitor built on CME 30-day fed funds futures as of September 19, with Reuters and FXEmpire FedWatch snapshots at 55% and 57.6%; the newest real-yield observation is September 17, one business day behind this snapshot; ETF holdings and official-sector purchases are monthly, so same-day GLD tonnage and any post-August 31 fund flow are unverified; and the two permitted vendors disagree on the long-window moving average, with FXEmpire's spot chart at $4,541.23 for the 200-day against Investing.com's $4,345.76. 461519
This briefing is published for active traders and sets out probabilistic technical and fundamental scenarios. Treat it as market analysis, verify live quotes, execution spreads and broker margin terms before committing capital, and predefine a stop and an invalidation level on every position.
References
- 1CNBC XAU/USD quote
cnbc.com
- 2Reuters: Gold rises to one-week high
reuters.com
- 3FXEmpire live gold page
fxempire.com
- 4Investing.com XAU/USD technical analysis
investing.com
- 5
- 6Investing.com Fed Rate Monitor Tool
investing.com
- 7FXEmpire: The Week Ahead
fxempire.com
- 8
- 9Federal Reserve: FOMC statement, September 16, 2026
federalreserve.gov
- 10
- 11
- 12Reuters: Gold gains over 2% on weaker dollar
reuters.com
- 13
- 14
- 15
- 16
- 17CNBC US10Y quote
cnbc.com
- 18CNBC .DXY quote
cnbc.com
- 19FRED: 10-year TIPS real yield (DFII10)
fred.stlouisfed.org
- 20FRED: 5-year TIPS real yield (DFII5)
fred.stlouisfed.org
- 21FRED: 10-year breakeven inflation rate (T10YIE)
fred.stlouisfed.org
- 22
- 23
- 24
- 25
- 26
- 27Federal Reserve: calendar, September 2026
federalreserve.gov
- 28BEA: Release schedule
bea.gov
This story was produced automatically by a channel. One sentence is all it takes for Neodrop to keep producing for you.